To increase the number of Resolution points (lines) there are 2 methods:
- increase the Sample Rate (with old interfaces i400-i500-i600-i800)
- increase the Recording Time (only method available for GX400 4 channel interface)
To increase the Max Frequency, there is 1 method:
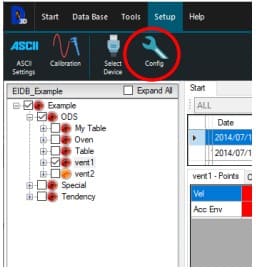
- increase the Sample Rate, select “Setup” and “Config” :
Examples:
With a Sample rate s/s = 11025 and Recording time 3s 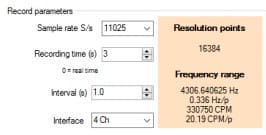
With a Sample rate s/s = 11025 and Recording time 12s 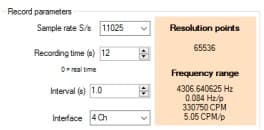
With a Sample rate s/s = 22050 and Recording time 3s 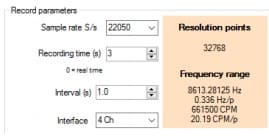
With a Sample rate s/s = 22050 and Recording time 12s 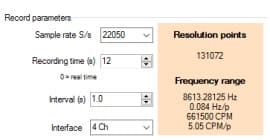
With a Sample rate s/s = 44100 and Recording time 3s 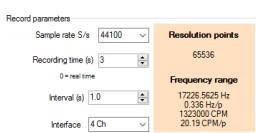
With a Sample rate s/s = 44100 and Recording time 12s 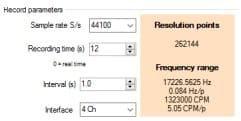
The higher the Recording Time is, better Resolution between points you will get. In these examples, the resolution is improved from 20.19 CPM between 2 points with 3s recording to 5.05 CPM between 2 points. With a Sample rate of 44100 s/s and a Recording Time of 96 seconds (1 minute 36 seconds), you achieve:
- more than 2 million resolution points
- Max frequency of 17 kHz or 1.3 million CPM
- 63 CPM between points
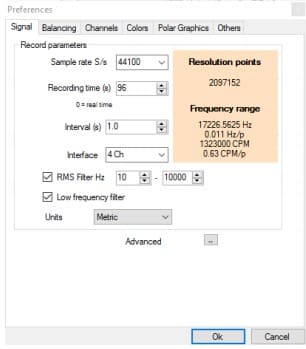
Of course, depending on the sensor, it makes sense or not to measure with such precision. These long recordings consume more machine resources in terms of memory space and processing.
Setting a new bearing into the database
When you create a new machine in the database (or when you edit its configuration) you can add the bearing’s information on the corresponding area: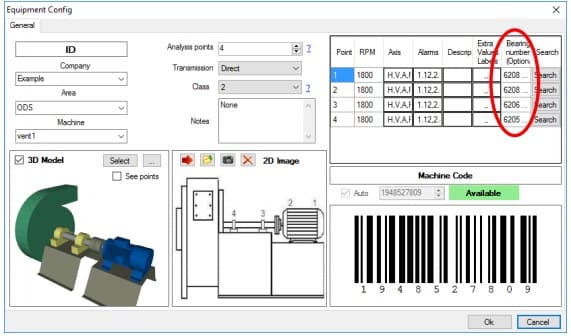
If one of the bearings of the machine is not in the 25’000 items database, you can add the frequency information manually: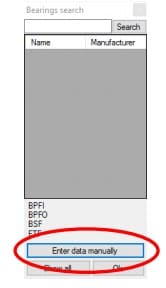
Contact the bearing manufacturer website to be informed about the frequencies in “orders”:
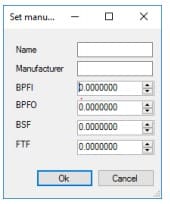 BPFI (Ball passing frequency inner race)
- BPFO (Ball passing frequency outer race)
- BSF (Ball spin frequency)
- FTF (Fundamental train frequency)
Example:
BPFI = 0.55-0.6 x No. of balls x RPM BPFO=0.45 x No. of balls x RPM BSF = 3.5 x RPM
In this example, we have a recording of vibration on point 1-H:
- select the rotation speed (1797 CPM)
- select the bearing of this point
- click on “Frequency calculate”
- click on “Show Markers” to plot the damage frequencies on the FFT graphic
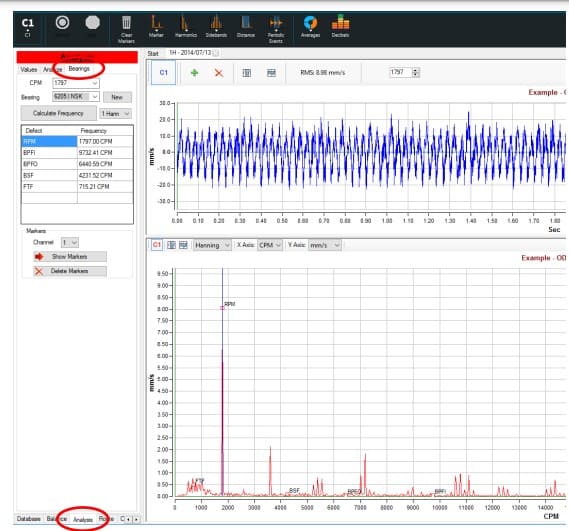
You can right-click on each graphic to add and print it to the report.