What is Digivibe MX®?
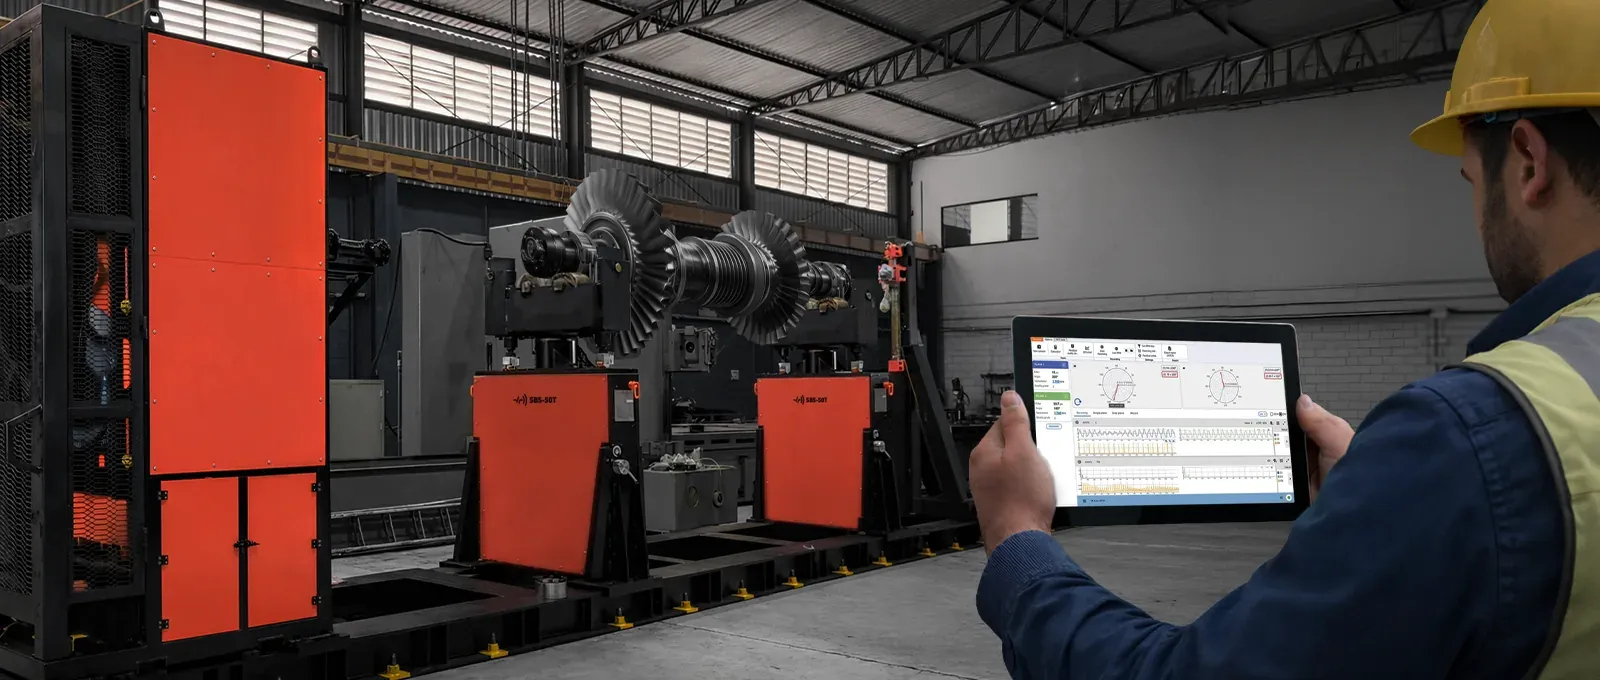
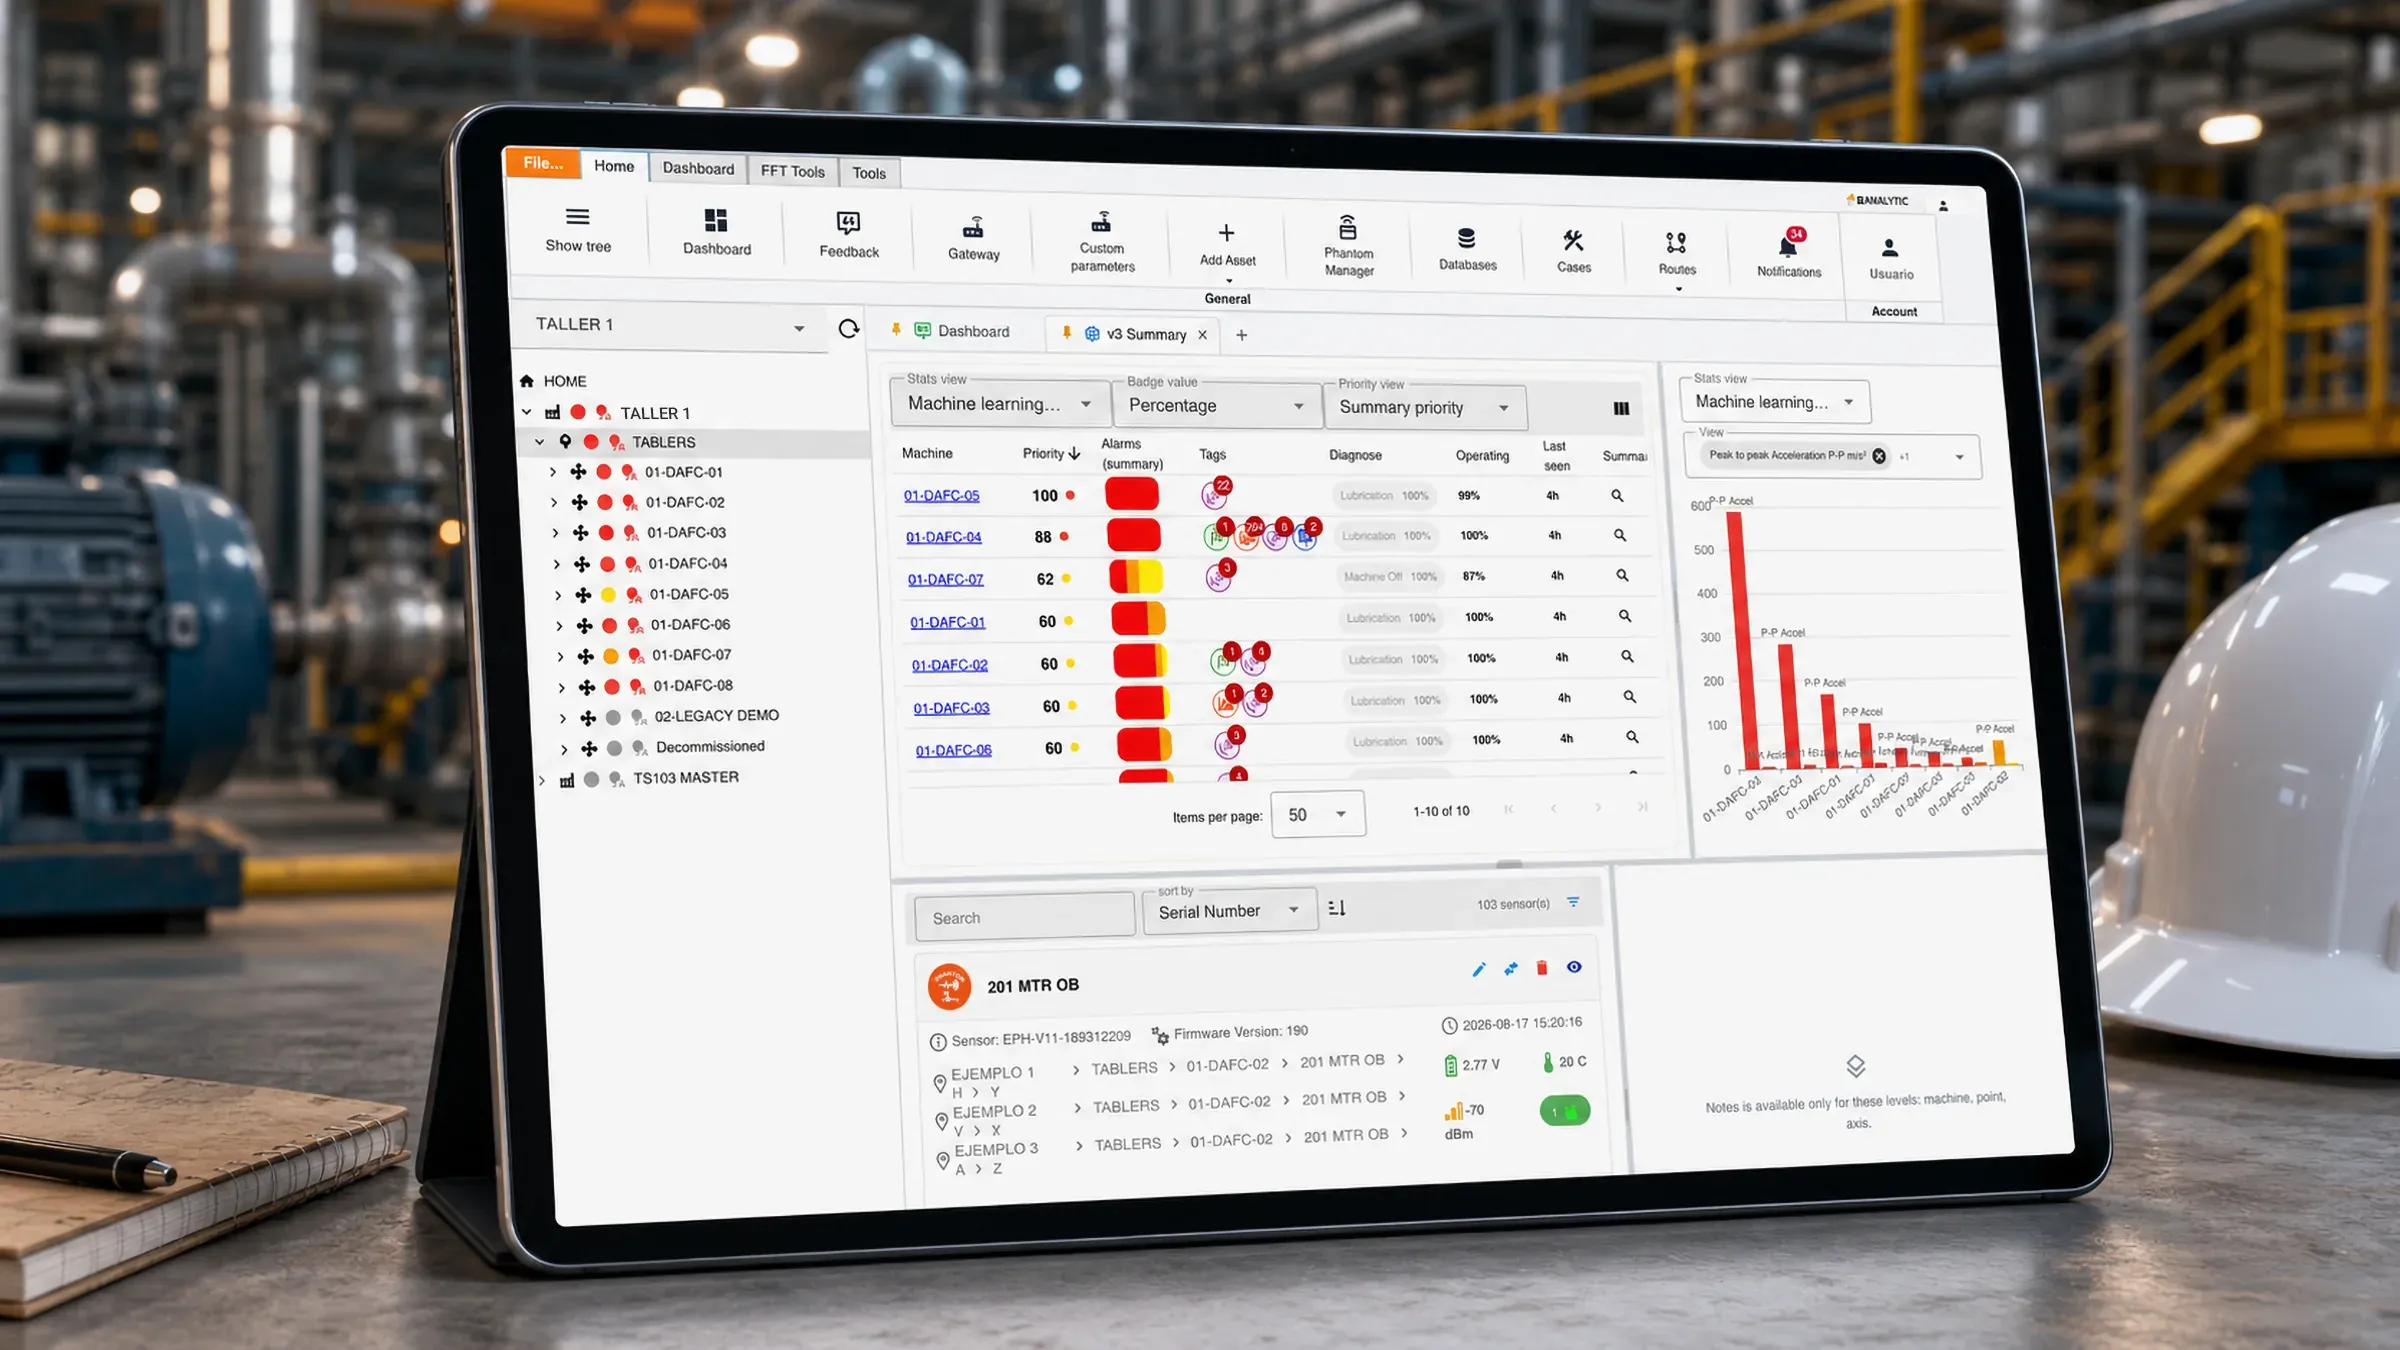
Digivibe MX® is the vibration analysis and predictive maintenance platform from ERBESSD INSTRUMENTS®. It brings the analyst’s entire workflow into a single software — and it runs on the desktop and on mobile, standalone or connected to the EI-Analytic™ cloud platform.
-
Measure
With the GX-400, WiSER and Defiant interfaces — or automatically, from PHANTOM® wireless sensors.
-
Analyze
A complete FFT engine: spectrum, waveform, envelope, waterfall, orbits, digital filtering, FRF and coherence.
-
Diagnose
A rule engine names the fault and its severity; machine learning models learn what normal looks like on each machine.
-
Prioritize
Assets ranked by risk and urgency — not just by alarm color.
-
Correct
In the field: balancing in 1, 2 and 3 planes, modal analysis and ODS.
-
Follow up
Cases with comments, owners and attached evidence — so the knowledge doesn’t get lost.
Portable analyzer
Three pieces, one licence: the portable analyzer
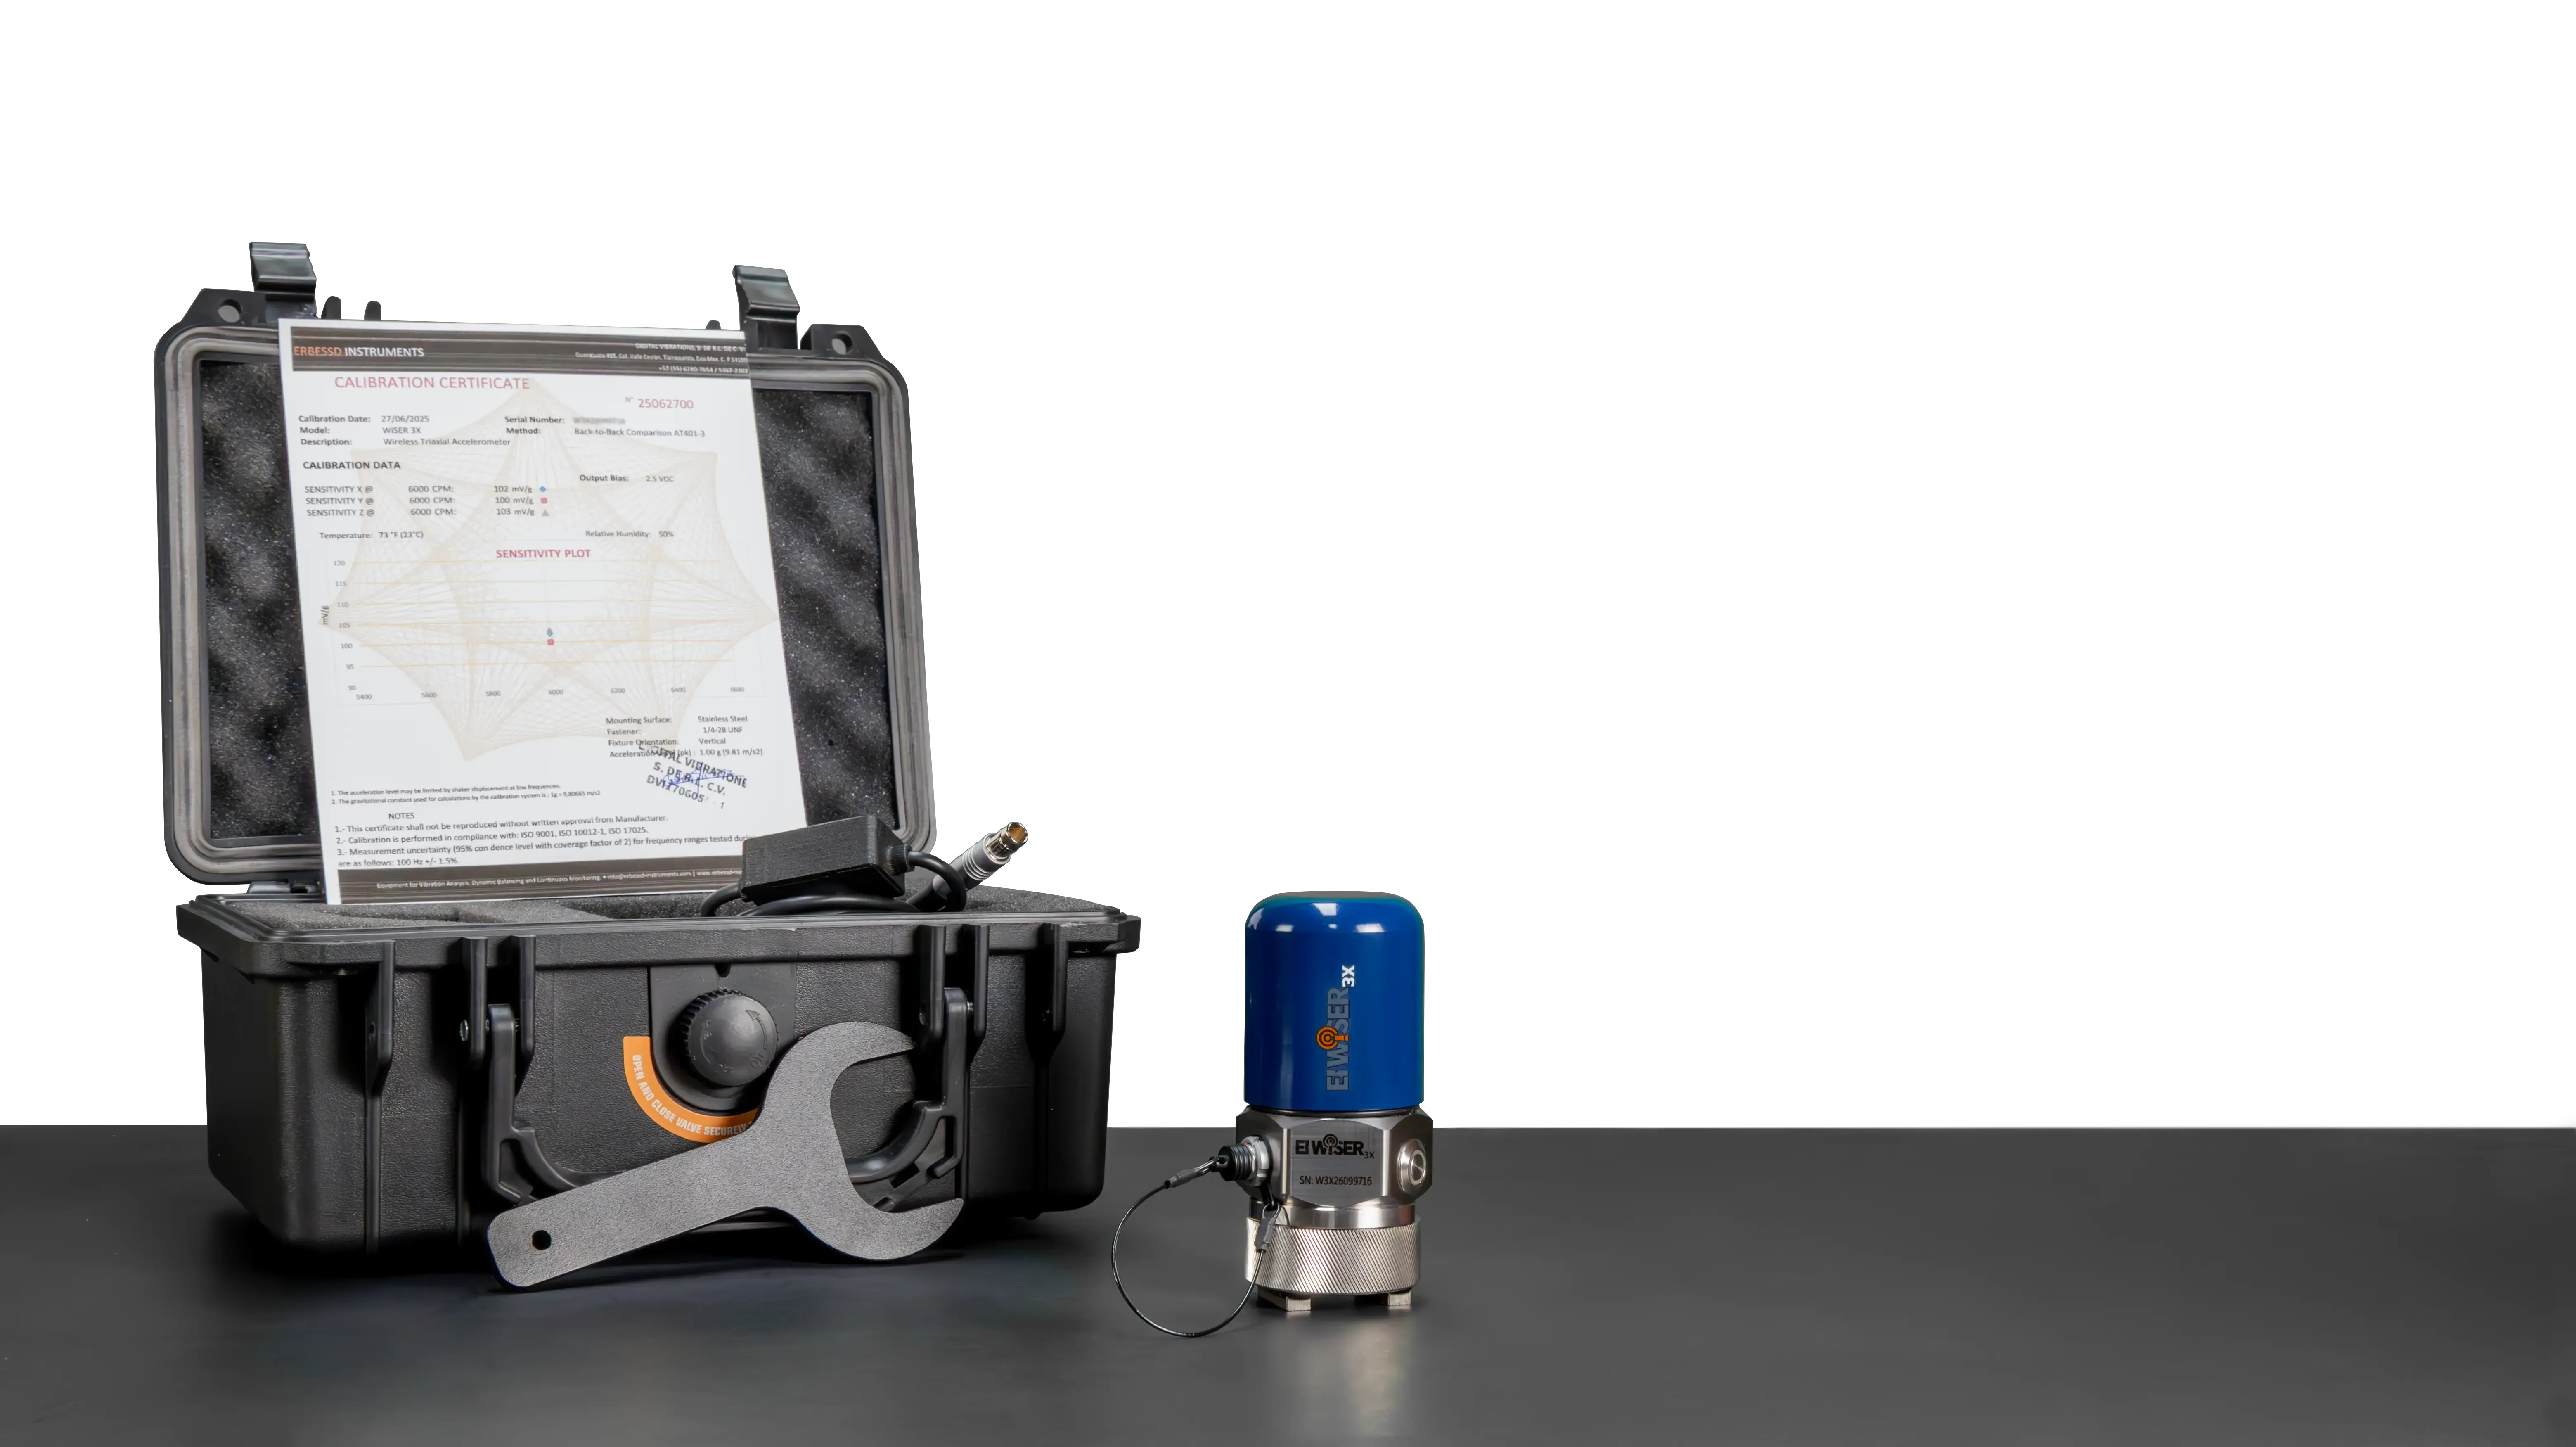
Digivibe MX® with an EI WiSER® 3X or a GX-400 is a complete portable vibration analyzer. The software, a tablet or laptop, and the interface that gets the signal in — wireless or wired — are the whole instrument, assembled from parts you can replace and upgrade separately.
The same licence also unlocks WiSER VIBE® on your phone or tablet, iOS or Android — not as a viewer, but with the balancing and analysis functions of the desktop. One purchase, two instruments: the phone for the route, the tablet for the deep analysis, and the same database behind both.
That combination is why we call it the most powerful portable analyzer on the market: four simultaneous channels, lines of resolution set by the recording rather than the instrument, phase, balancing, ODS and a database on a server you own.
| Wireless | Wired | |
|---|---|---|
| Interface | EI WiSER® 3X | GX-400 |
| Simultaneous channels | 3 axes plus 1 additional channel (accelerometer or optical sensor) | 4 — a triaxial plus a tachometer, or up to four single-axis accelerometers |
| Sample rate | 48,000 Hz, 24-bit | 48,000 Hz |
| Frequency range | 0.5 Hz to 10 kHz (±3 dB) | 0.5 Hz to 24 kHz — the accelerometer becomes the limit, not the interface |
| Connection | Wi-Fi direct to the phone or tablet, no receiver, up to 20 m | USB, three 5-pin LEMO ports, IP67 |
| Where it shines | Routes, off-route checks, ODS with an optical reference, on-site balancing | Two-plane balancing with two accelerometers and a tachometer, any 5 V or 24 V accelerometer you already own |
| Runs WiSER VIBE® too | Yes | Yes |
Which of the ten specifications matter when you compare portable analyzers, and why this arrangement answers them, is in The Best Vibration Analyzer in 2026: How to Choose One.
Your data stays yours
Digivibe MX® stores your measurements in open, standard databases — SQL Server, MySQL and Azure. Not in a proprietary format, and not in a vault only we can open.
That has three consequences worth saying plainly:
- The data belongs to you. It lives in your own database, on your server or in your Azure tenant. You can query it, export it and back it up with any standard tool.
- You keep full control. Nobody in the middle decides who reaches what, or for how long.
- No subscription to stay inside. Keeping access to the history you already collected does not depend on a recurring payment.
And getting the data out is not a favour we do you. There are three routes, and they are all yours to use:
| Industrial protocols | Modbus, MQTT and OPC |
| Cloud API | Download your data into any other application |
| Local backups | Built-in tools, on your own schedule |
For a monitoring program that is meant to last years, this is what makes the difference between building an asset of your own and renting access to it.
Erby
A vibration analyst that lives inside the software
Erby is the AI assistant built into EI-Analytic™ and the Digivibe MX® suite. It is not a generic chatbot: it knows the software, your machines and your data, and it exists to give hours back to whoever analyses vibration.
What it does
- It guides you, and takes you there. Ask how a route is configured or where a pump’s alarms are, and besides explaining it, it opens that screen.
- It configures for you. From a photo of the machine or its nameplate it registers the whole asset — measurement points, bearings, speeds, down to the 3D model and the ODS project. You review and save.
- It builds dashboards, signals and filters. Describe what you want to see and it hands you the finished dashboard, a synthetic signal for testing or a reusable filter chain.
- It diagnoses with evidence. It reads the machine’s datasheet, its trends, octave bands, spectrum and waveform, zooms into harmonics and sidebands, compares moments and axes, and delivers a verdict you can verify, with configuration recommendations.
- It learns from you. It remembers your criteria and analysis preferences — always visible, always undoable — and organises your conversations by project.
Why it matters. Expert analyst judgement is scarce and expensive. Erby puts it within reach of the whole team, on the real data of your machines, with a transparent cost: every answer shows what it cost. Your data never leaves your platform, and the assistant only acts when you confirm.
Why it gets it right: context, not just training. A language model already knows vibration analysis — the physics of bearings, gears, looseness and resonance, the standards, the textbook patterns. Nobody needs to teach it that again. What it cannot know is your machine: its datasheet and bearings, the operating modes it actually has, what its trend did over the last year, today’s spectrum next to last month’s, the notes your analysts left and the cases still open.
That is what Erby gets before it answers. The software assembles the context package, shows it to you before sending it, and hands the assistant the same moves you would make: zoom into the harmonics and sidebands, compare axes and moments, open the capture, read the octave bands. The answer is about this pump, not about pumps. Databases of other people’s failures are useful for starting points; the diagnosis of your machine comes from your machine, and it arrives with its evidence so you can check it. The long version is here.
One real job, in three screens. This is the whole loop: a photo goes in, an ODS session comes out, and it animates.
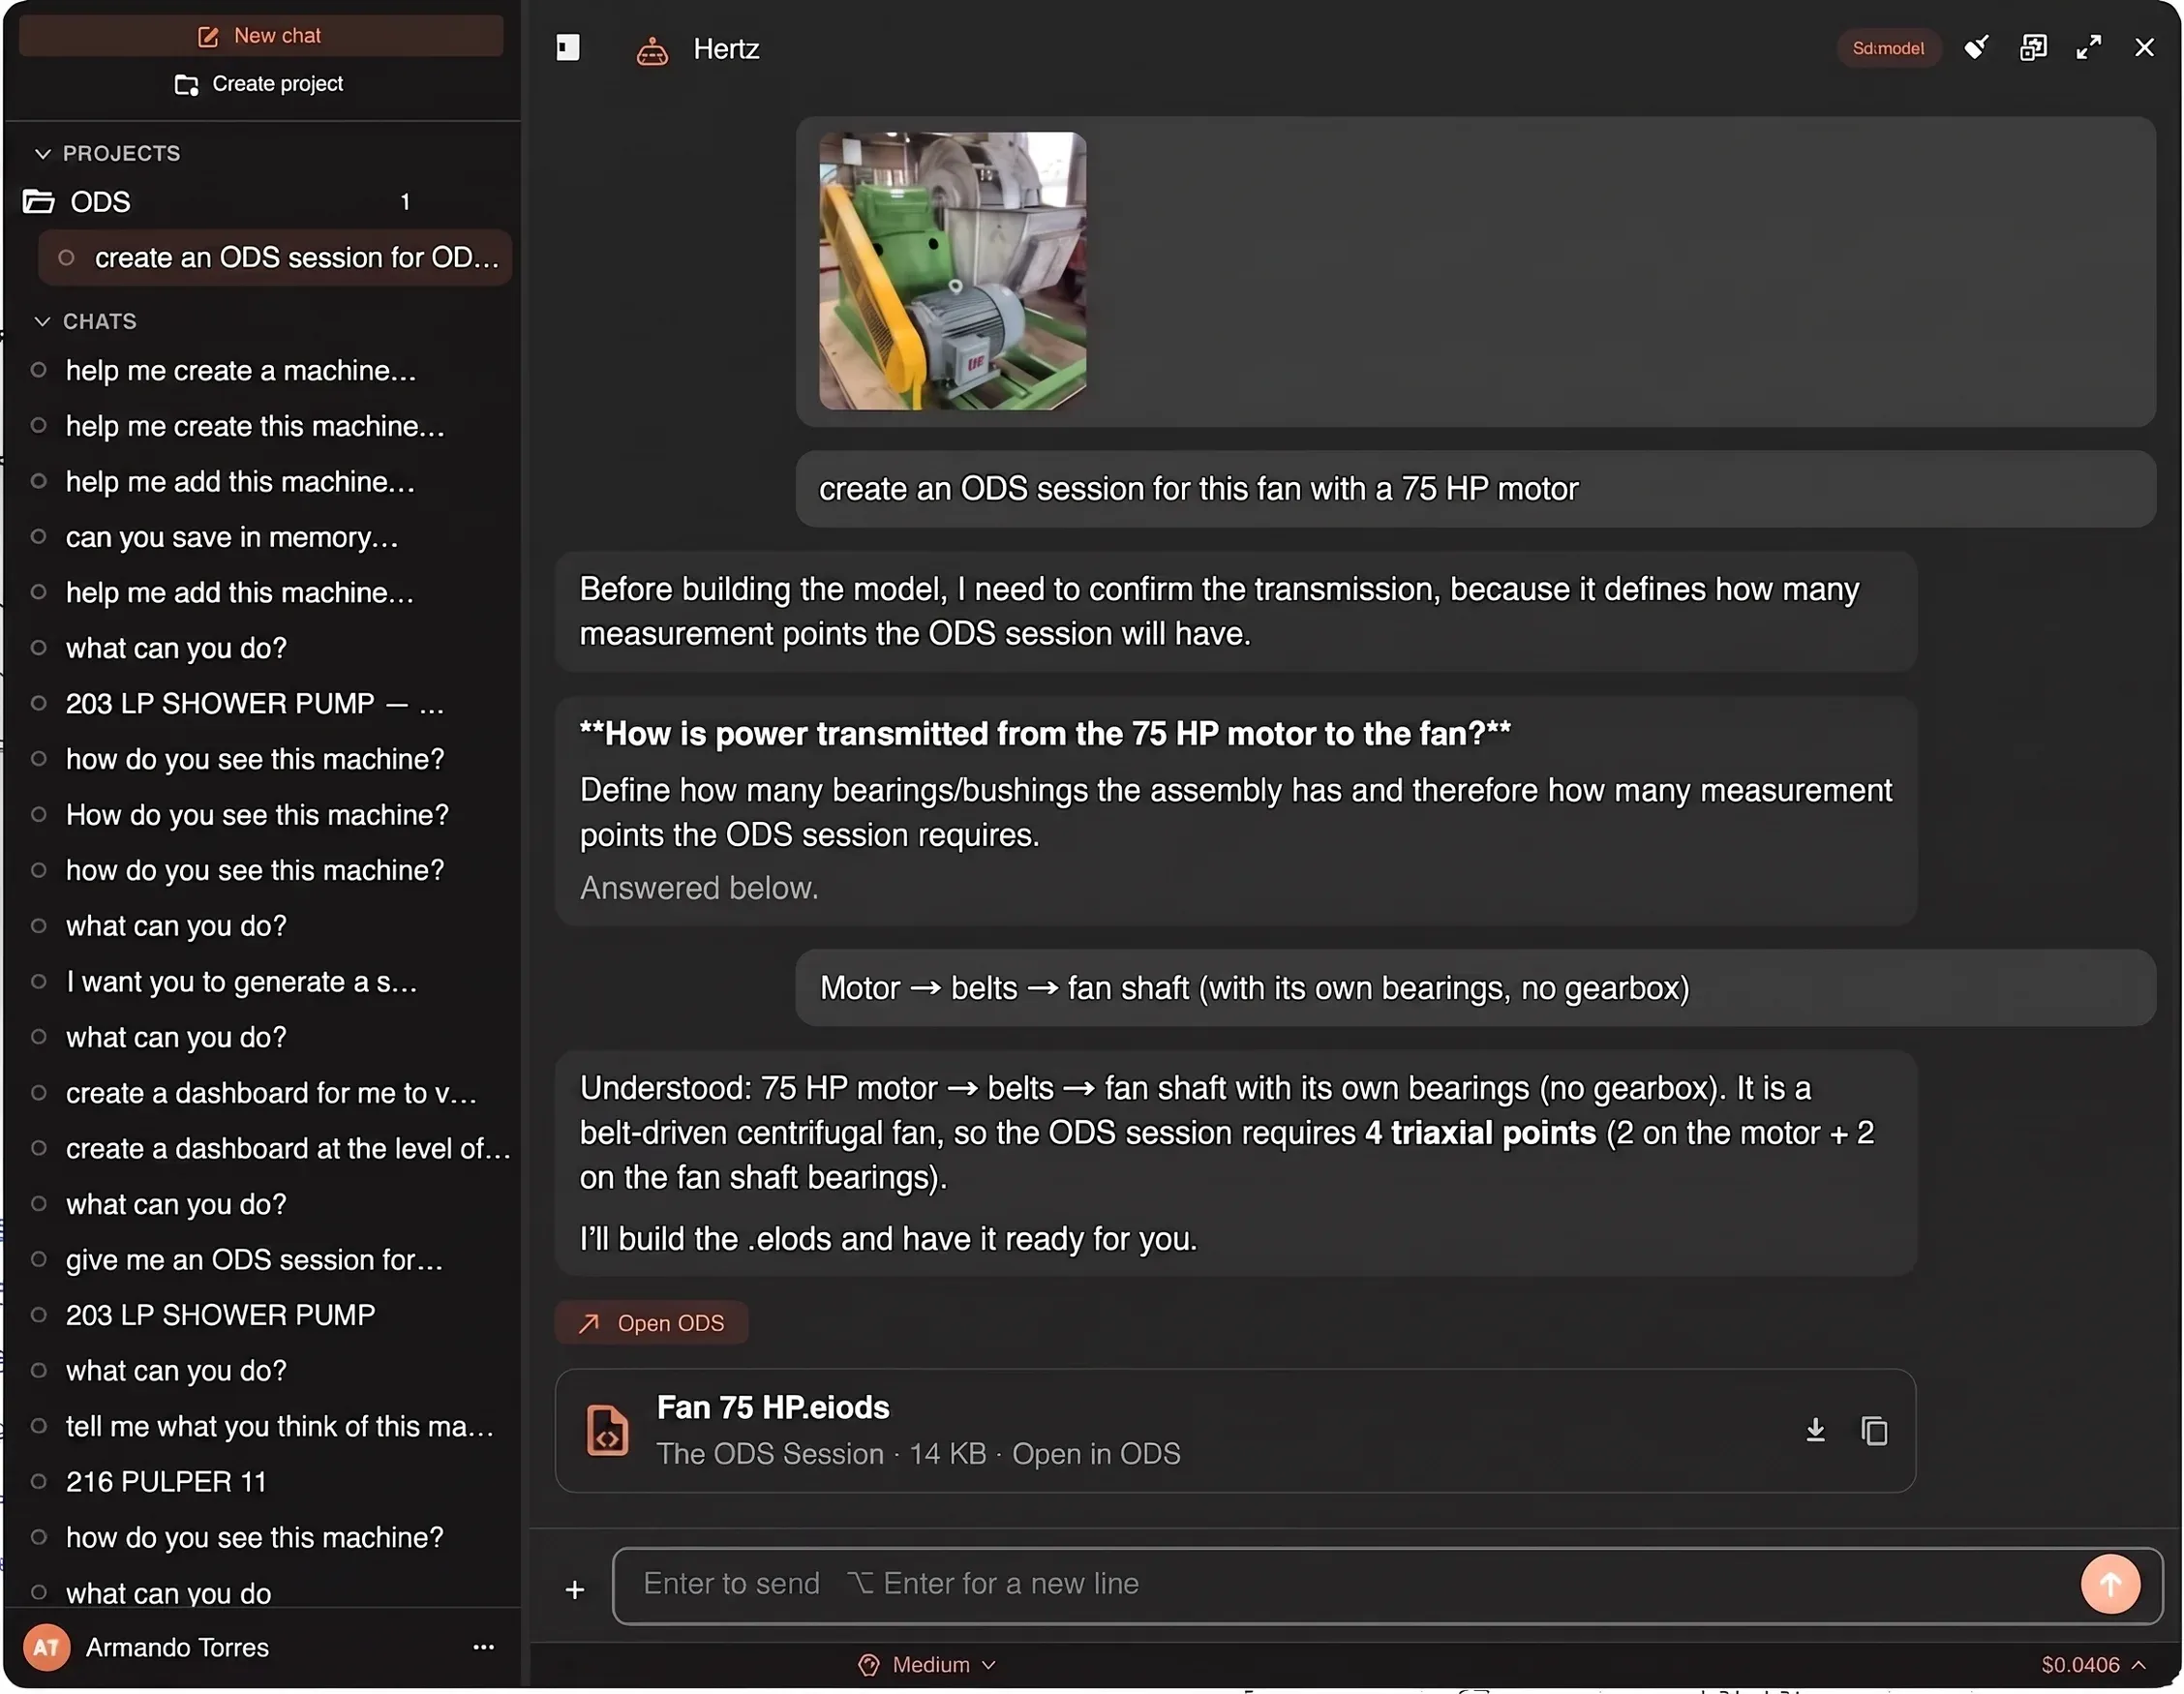
You hand it a photo, it asks the right question
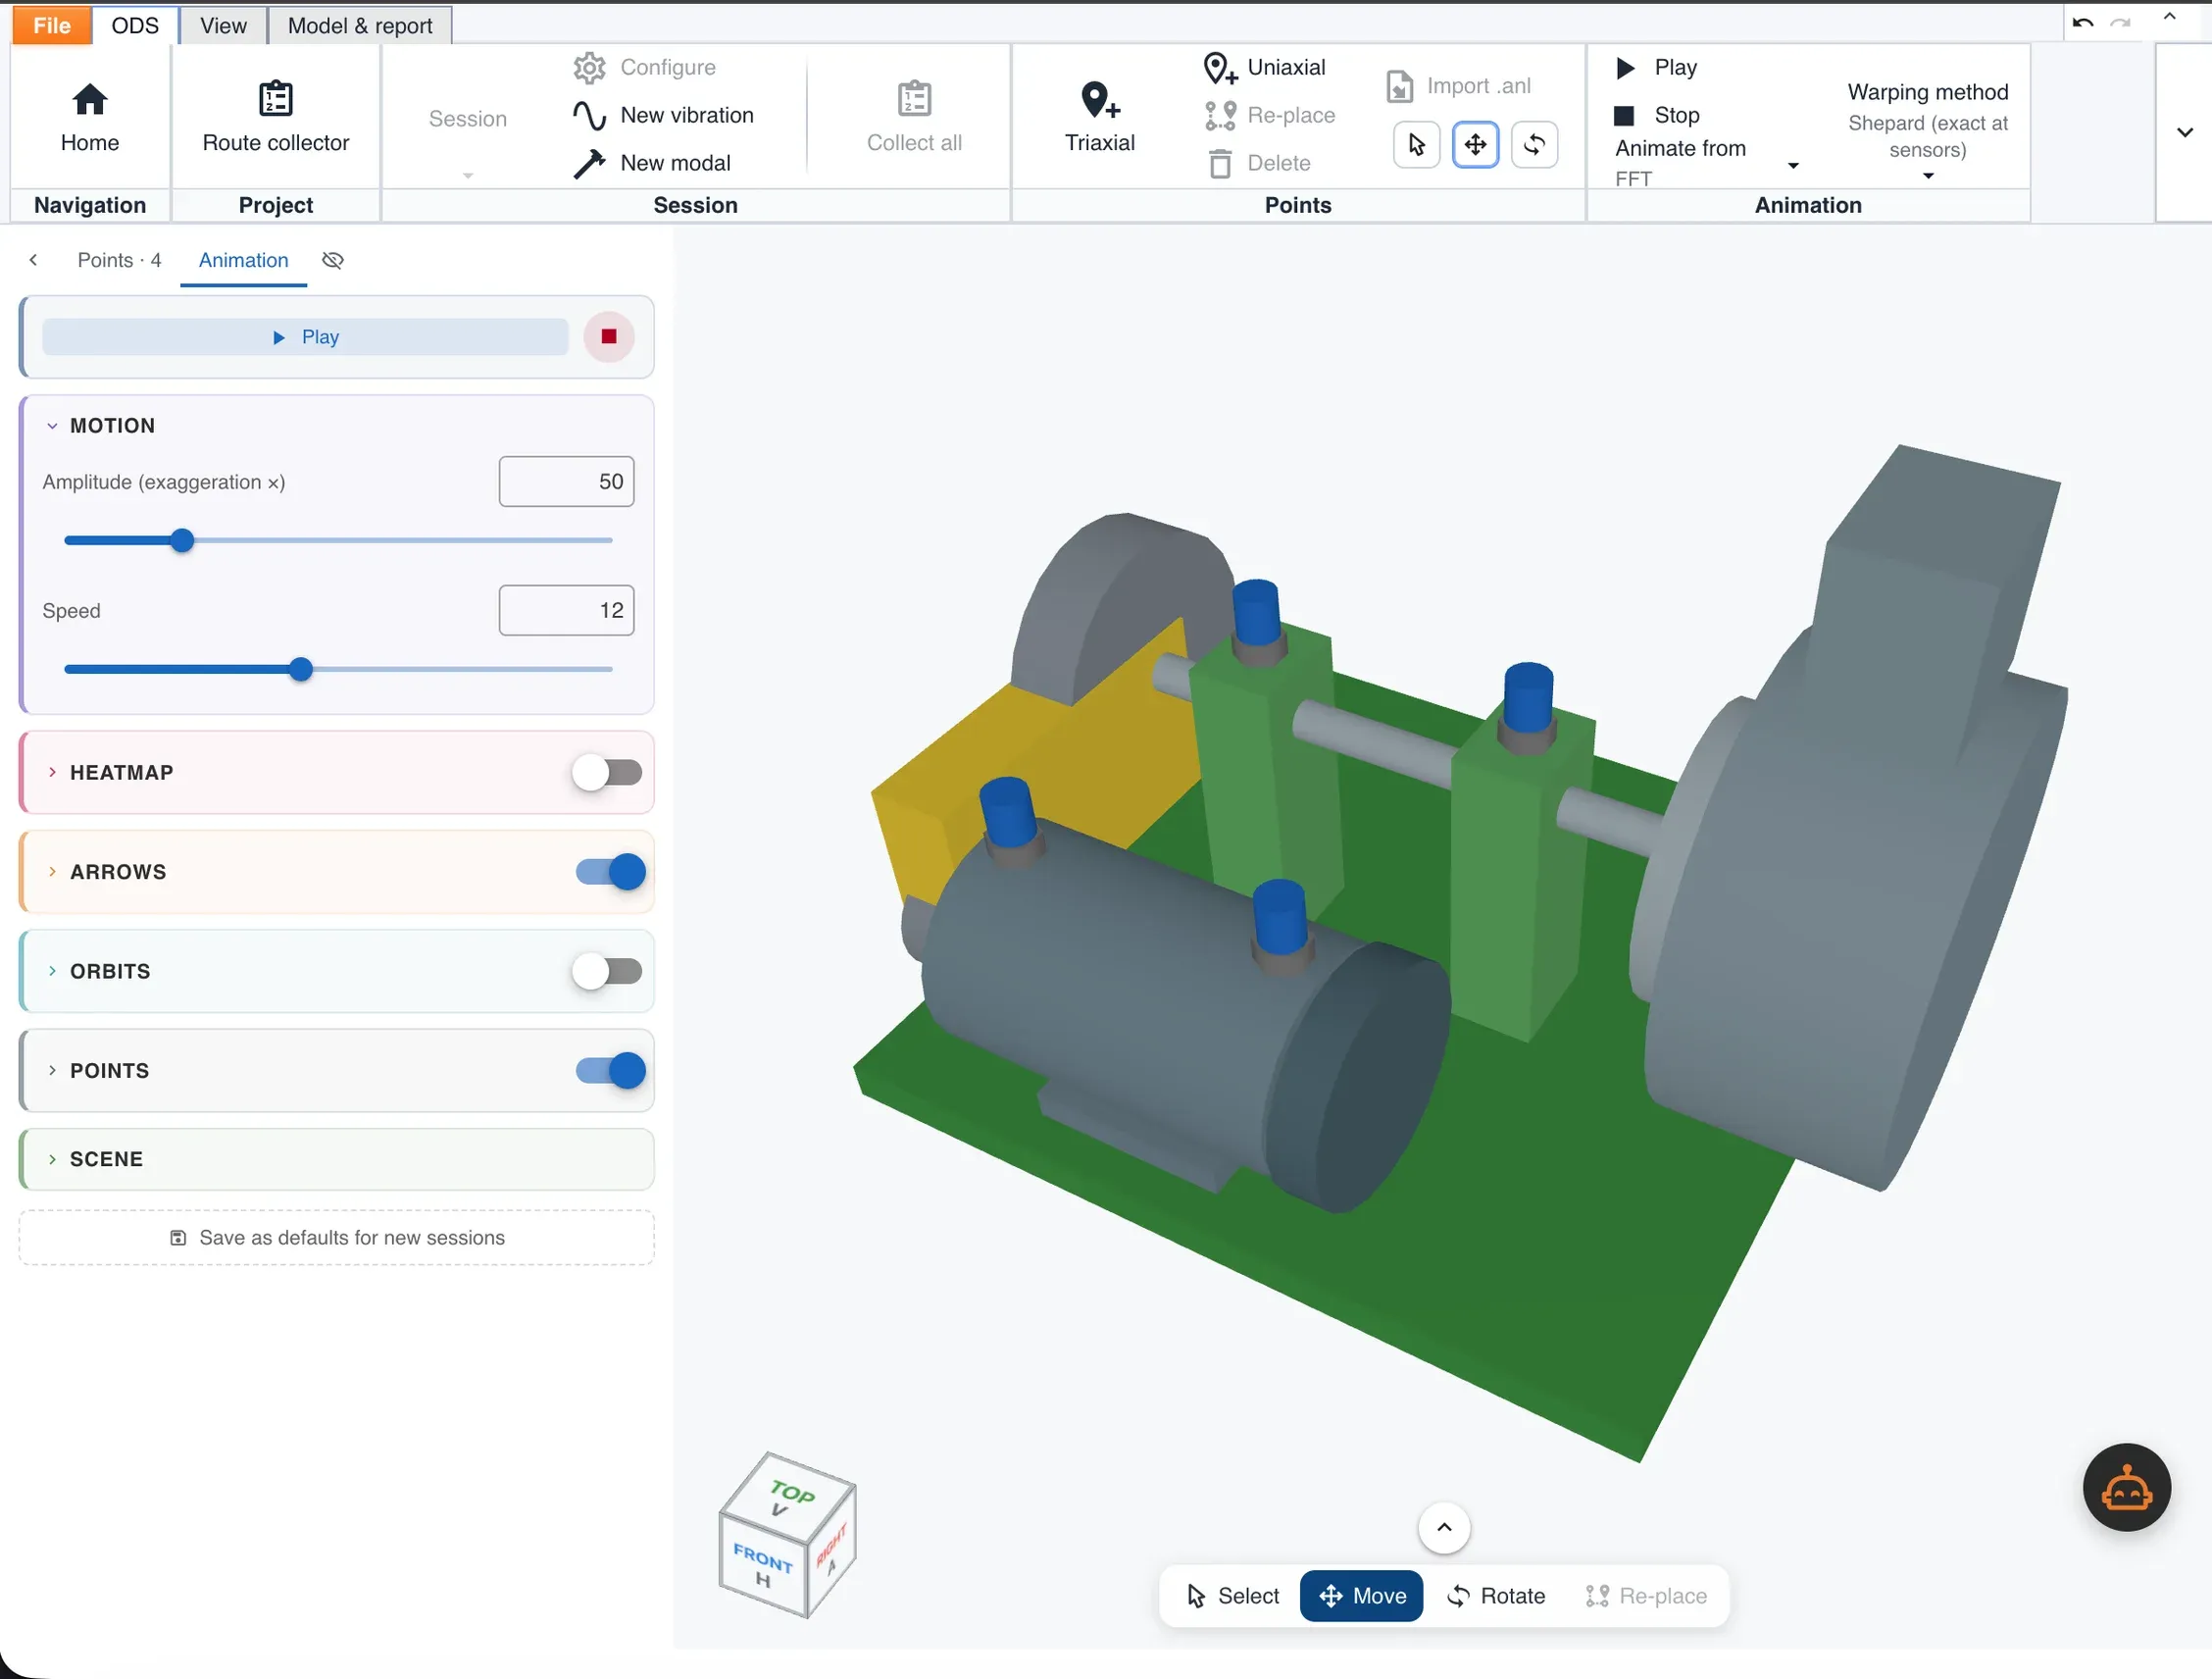
«Create an ODS session for this fan with a 75 HP motor.» Instead of guessing, Erby asks the one thing that decides the answer — how the power reaches the fan — and with «motor → belts → fan shaft» it concludes four triaxial points, two on the motor and two on the fan bearings, and builds the .eiods.
The session opens with the points already placed
The .eiods opens in ODS as a 3D model of that machine — motor, belt guard and fan — with the four measurement points where the assistant put them. You review and collect; nothing was drawn by hand.
And it animates the deformation
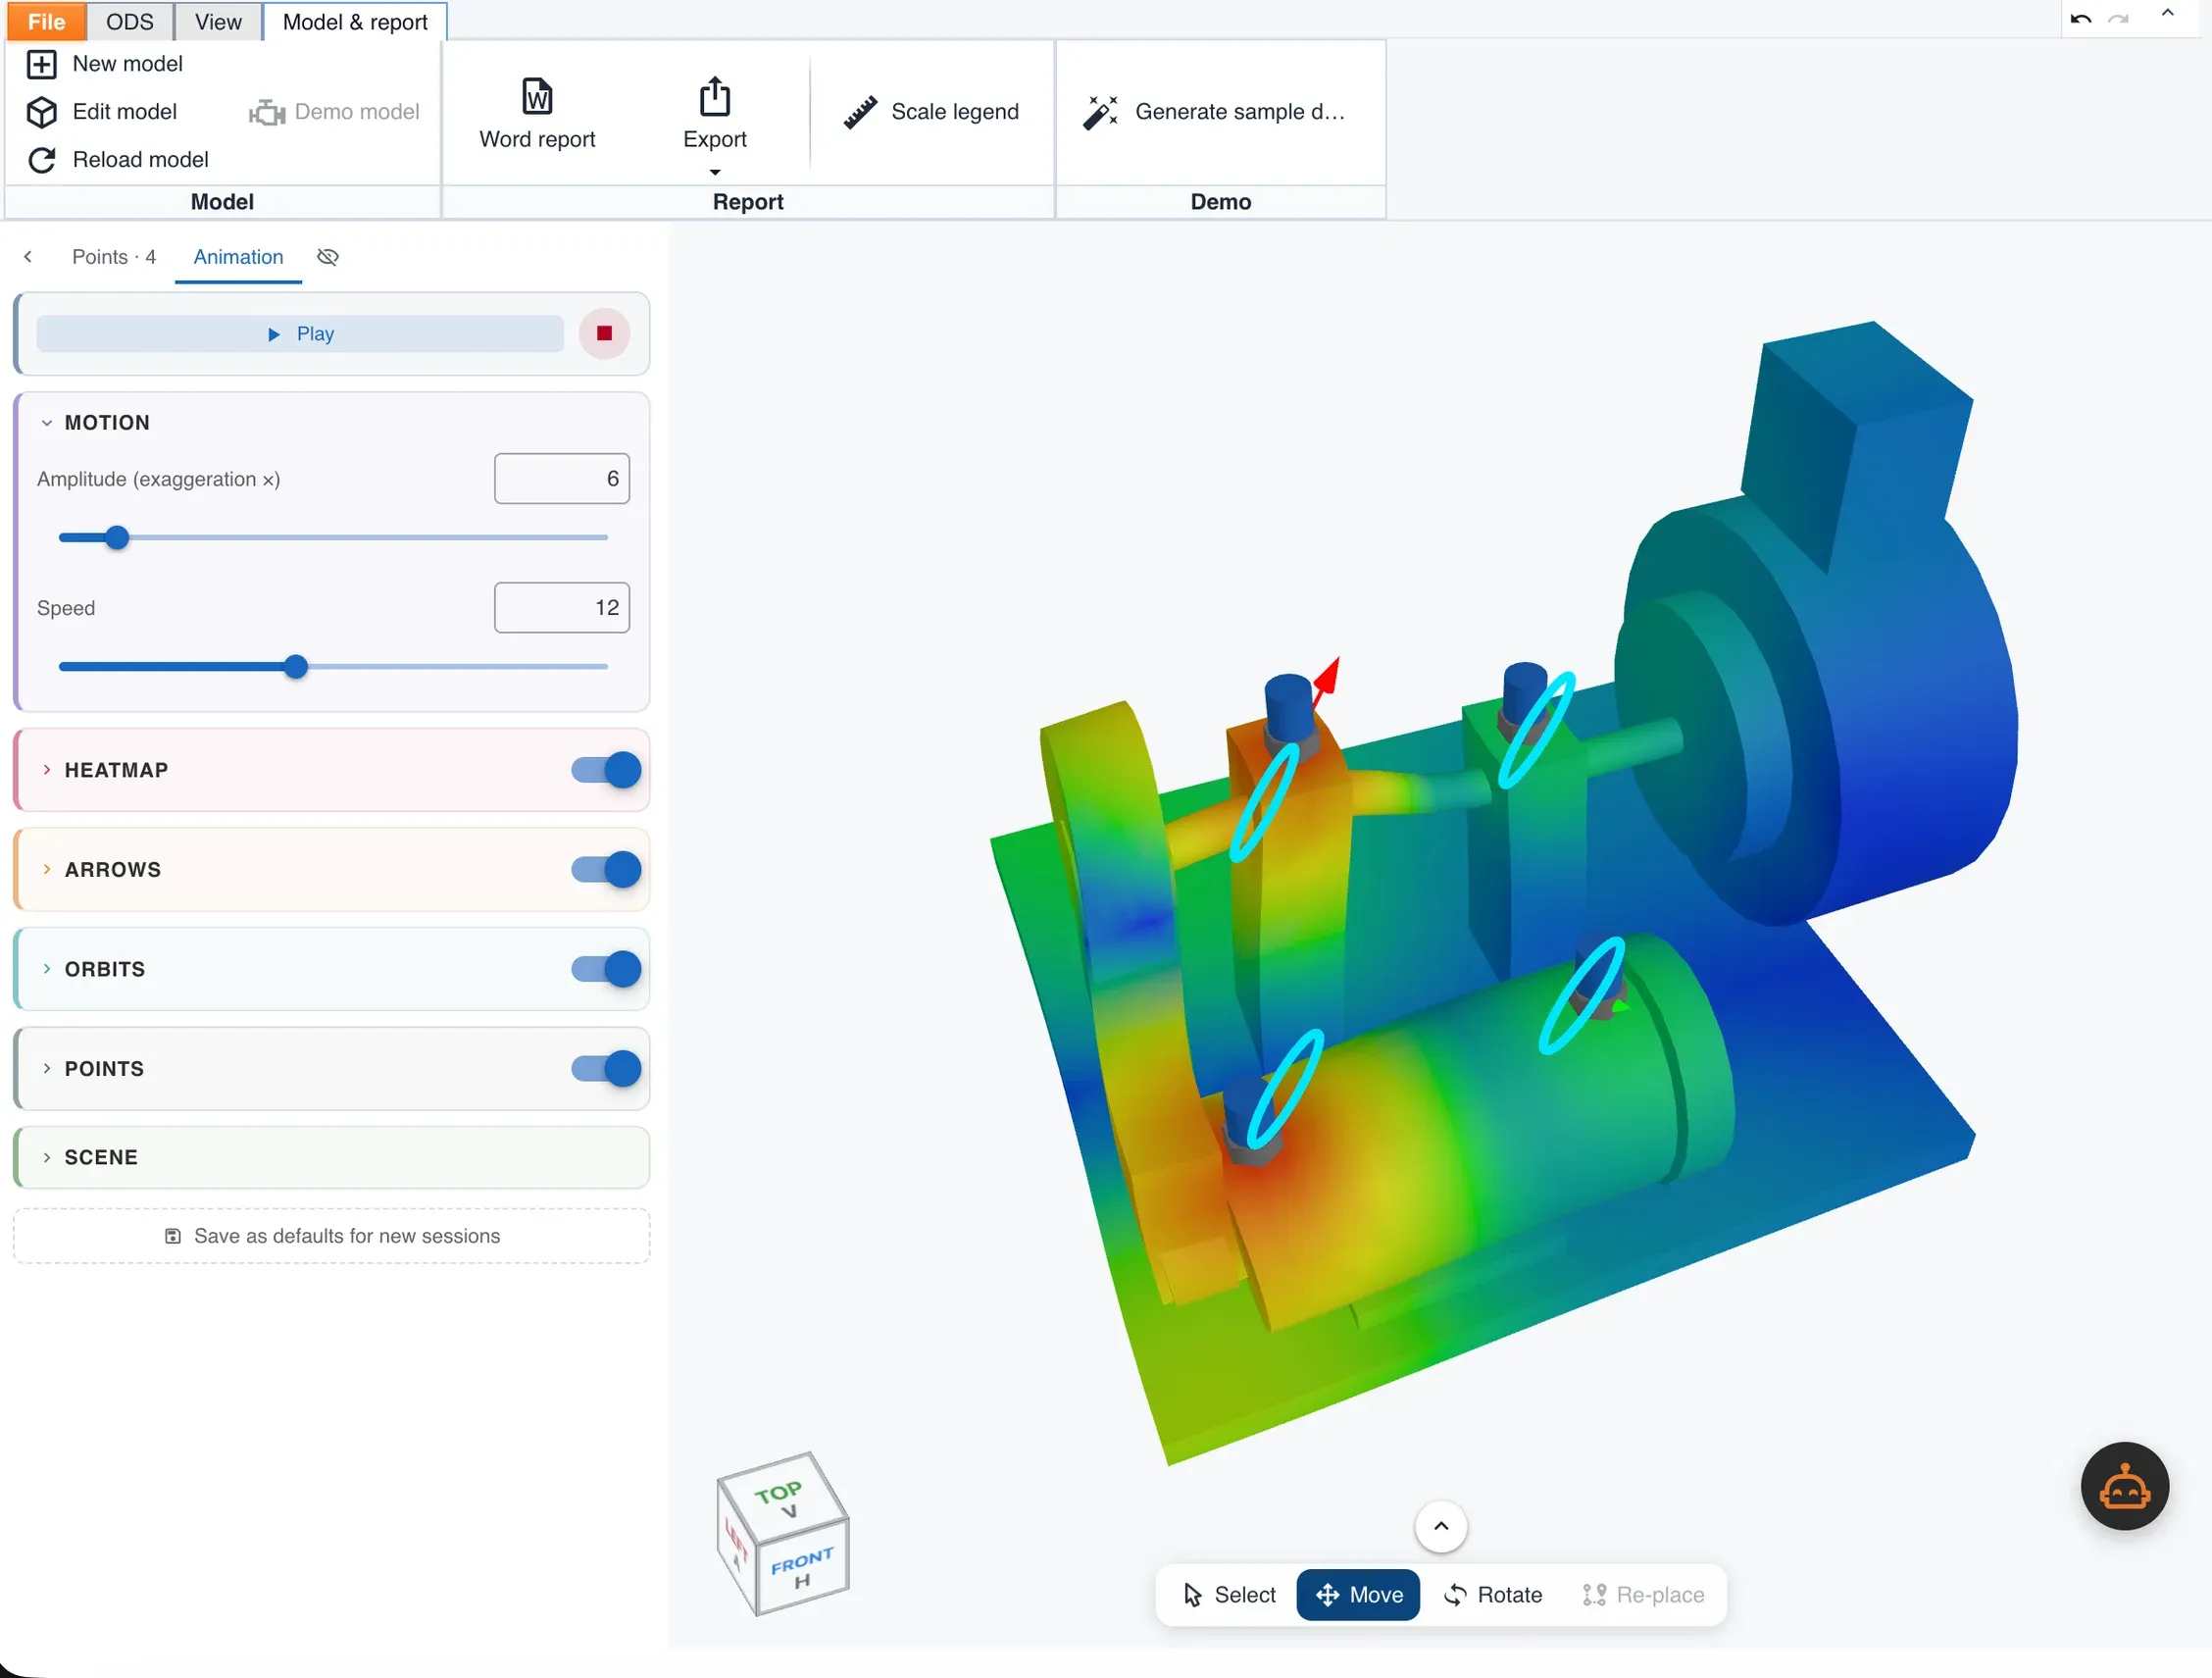
With the data in, the same model shows how the machine actually moves: heat map, motion arrows and orbits at each point, exaggerated as much as you need to see it — and straight to a Word report.
Which machine should you fix first?
An alarm tells you what is wrong. Digivibe MX® also tells you what to attend to first.
Every asset gets a priority score built from two different things:
| Component | What it measures | Weight |
|---|---|---|
| Risk | How bad it is today: the share of readings in red, orange and yellow | 60 % |
| Urgency | How fast it is getting worse: estimated time to failure and the trend slope | 40 % |
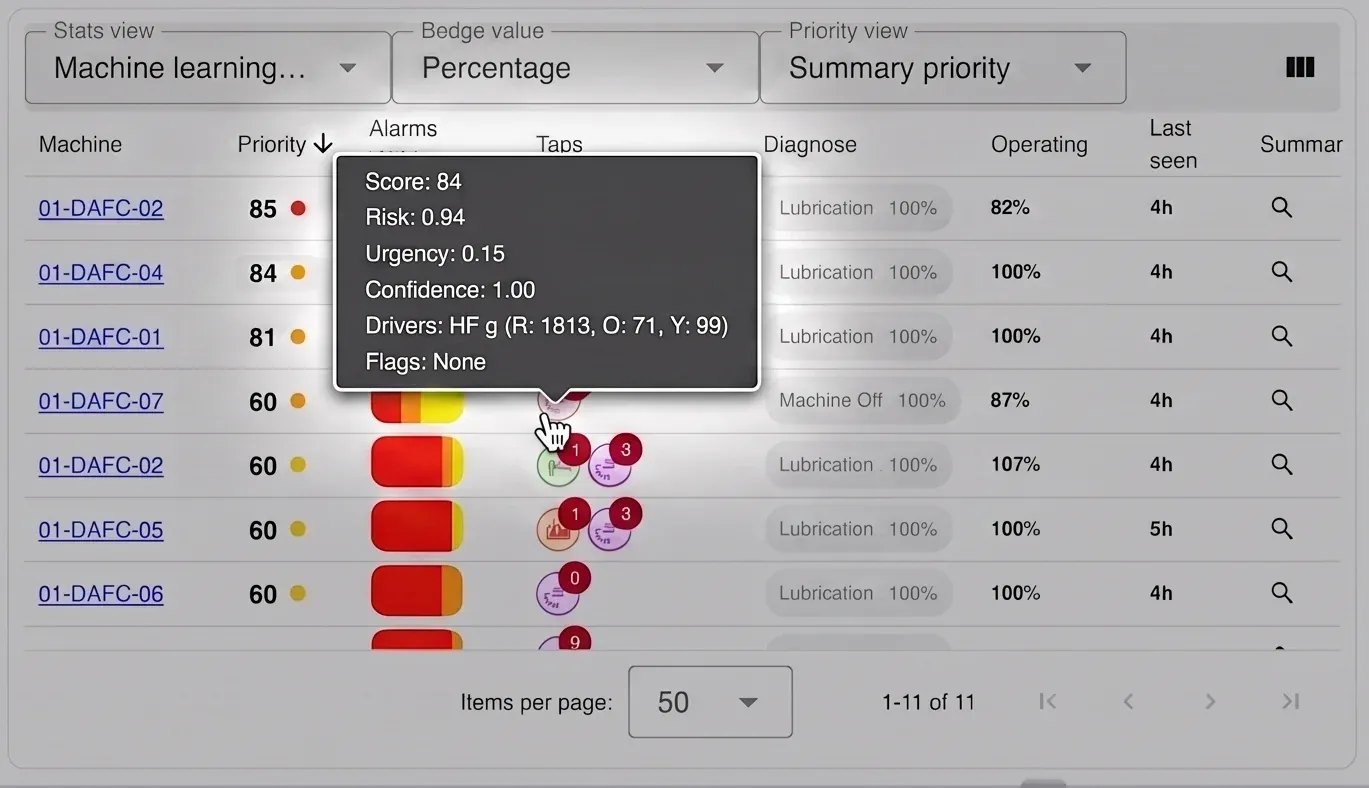
And it shows you enough to trust the number:
- Confidence — how recent and how consistent the data behind the score is.
- Drivers — which unit is pushing the priority up, and how many red, orange and yellow readings back it.
- Flags — honest warnings about data quality: no data, machine always off, stale information, little running time.
Priority propagates up the plant tree: an area inherits the urgency of its most critical machine, so a management view reflects what is happening at the point level without opening every point.
The result is a work list ordered by real consequence, not by the loudest color.
The dashboard is yours to build
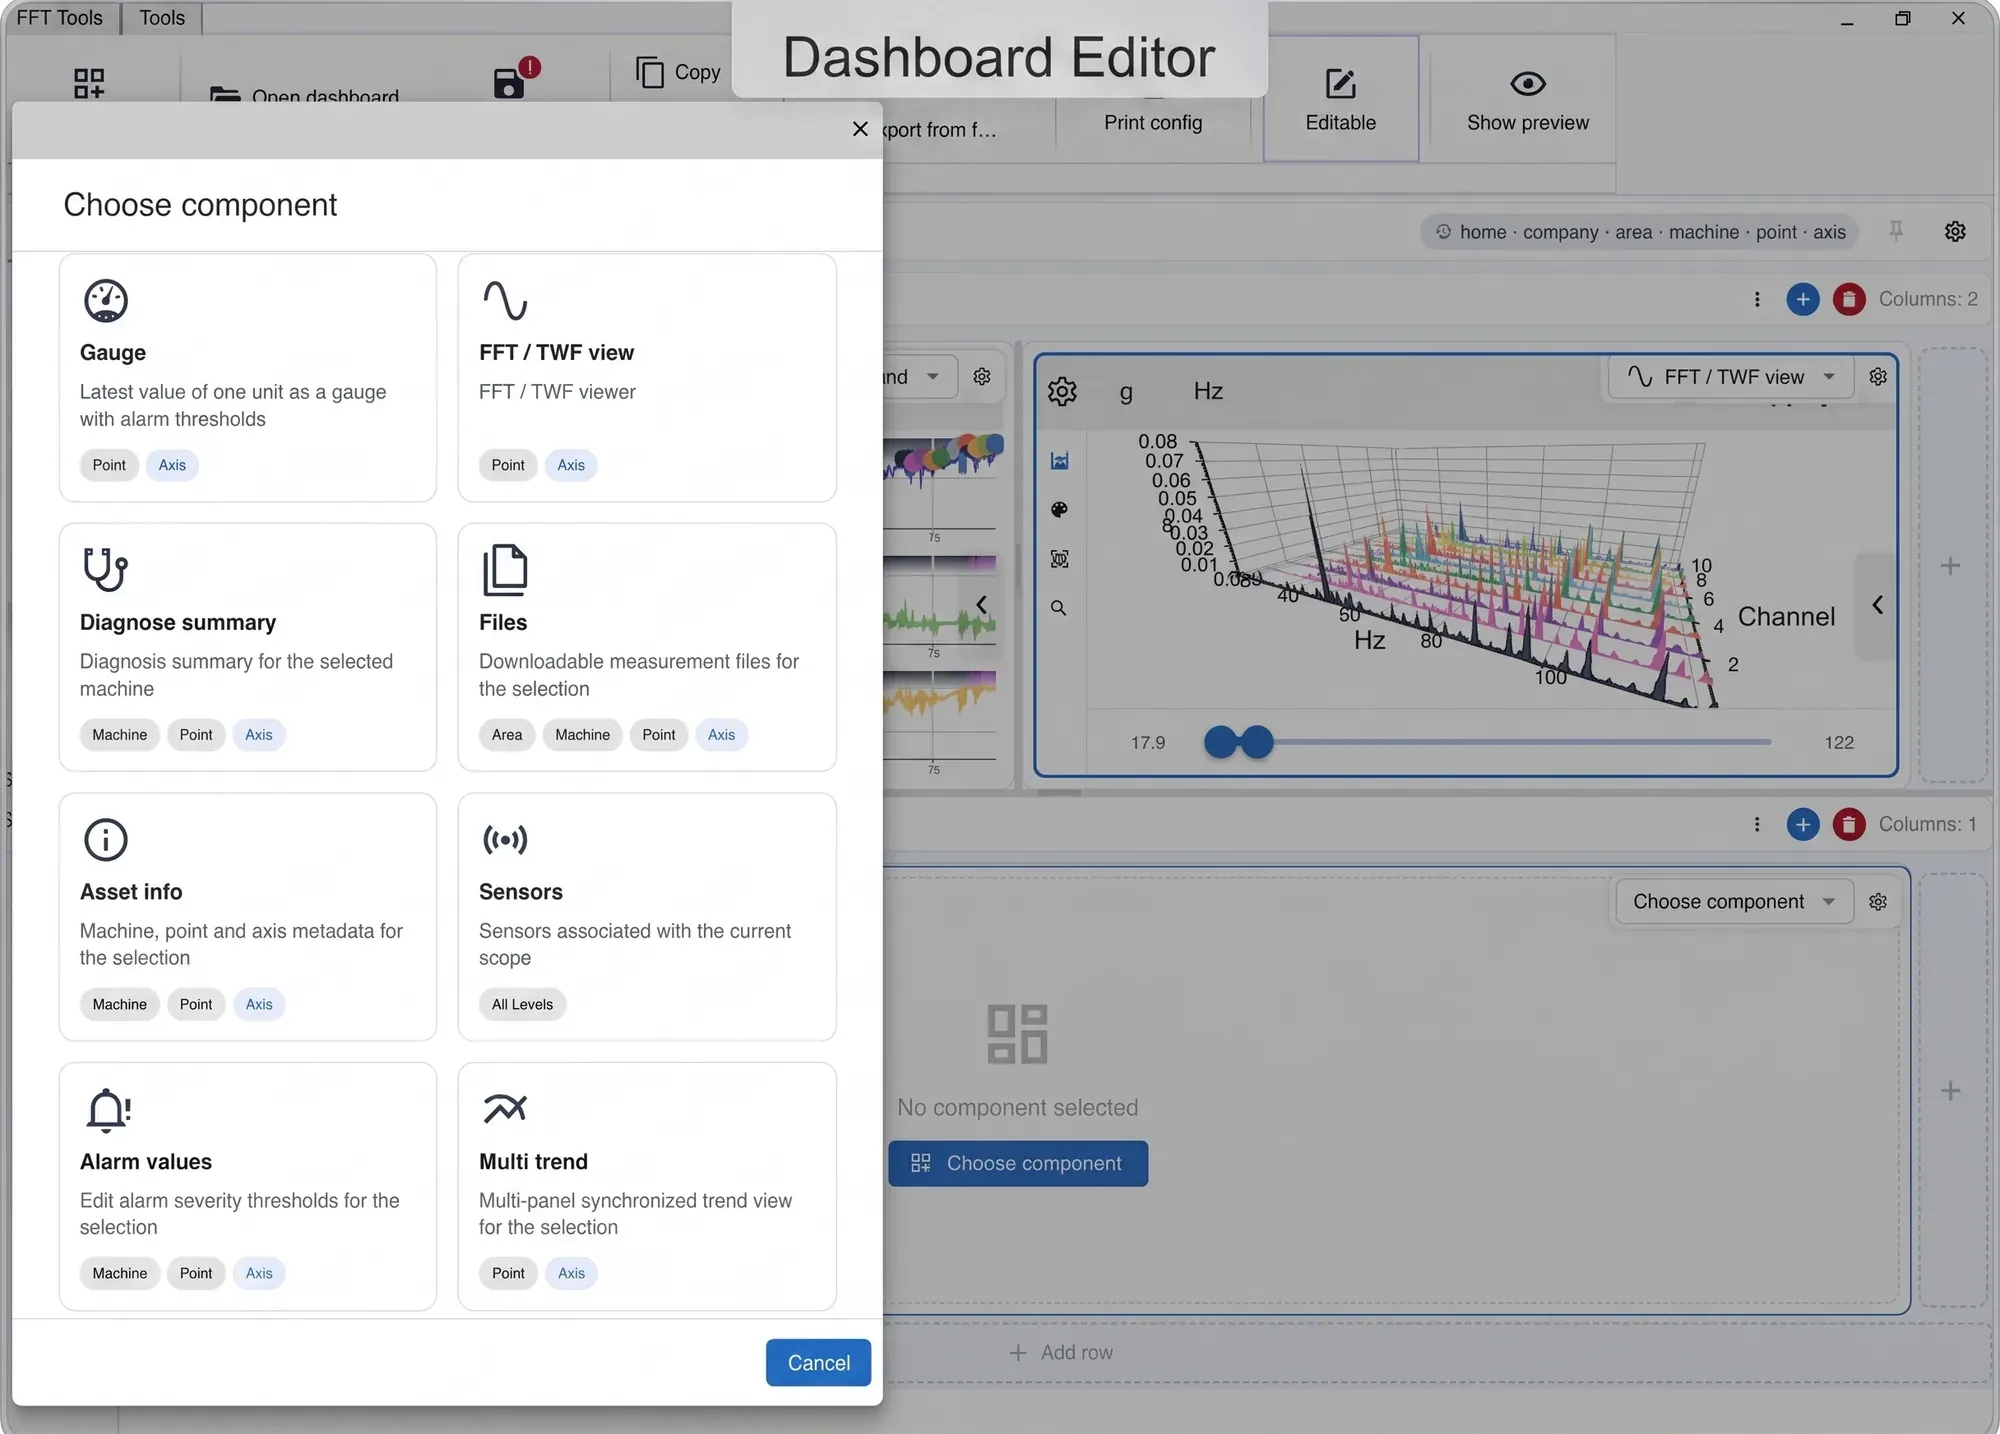
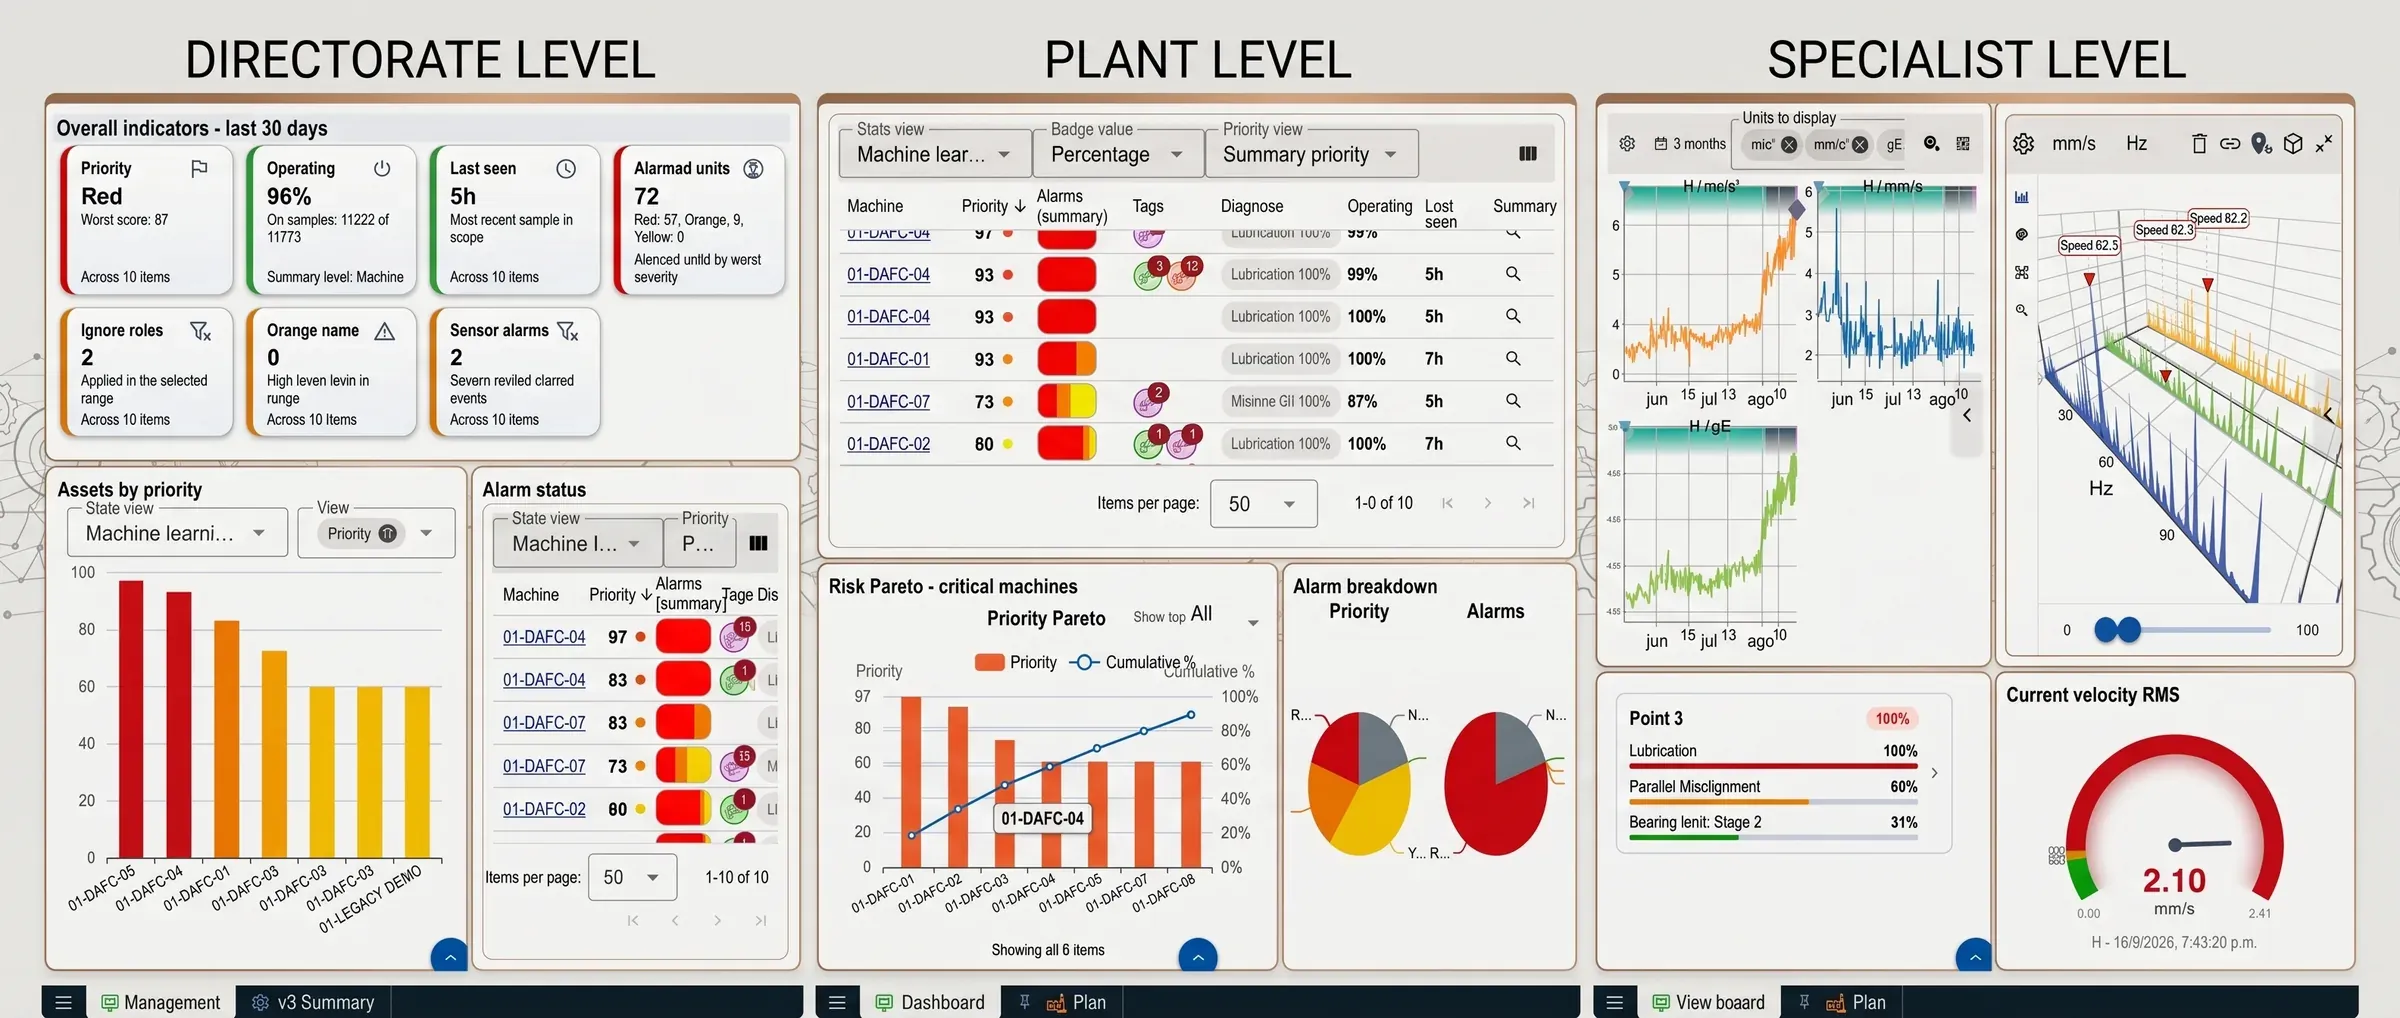
The Digivibe MX® dashboard is not a fixed screen. Each user builds their own boards: they define the grid, place the panels and choose which widget goes in each one.
How it is built
- Grid layout, with rows and columns that can be nested.
- Resizable panels in real time, by dragging the dividers.
- Each panel can carry its own title, with its own typography, color, border and alignment.
- Boards with a fixed height (everything fits on screen) or with scroll.
- Several boards live together as tabs, each with its name, icon and color.
It adapts to the tree level
Boards are declared for one or more levels of the hierarchy — company, area, machine, point and axis — and appear only where they make sense.
A single panel can even change widget depending on the level you select: a Pareto chart when you are standing on an area, a spectrum when you go down to a point.
Each panel can follow the tree selection or stay pinned to a fixed asset, so a board for a critical machine does not change as you navigate.
Machine learning, on two different problems
Operating modes, found on their own
You know how your own car sounds. One way on the motorway, another crawling through town, another again on a bad street. Nobody taught you those sounds and you could not put numbers to them — but the day one of them changes, you notice, and you call the mechanic before you know what is wrong.
Nobody is listening to your machines that way. Digivibe MX® does it with clustering: it groups measurements into operating modes on its own, with nobody labelling anything, and reports what changes as events — New mode when behaviour it has never seen appears, Old mode repeats when the machine returns to something already known.
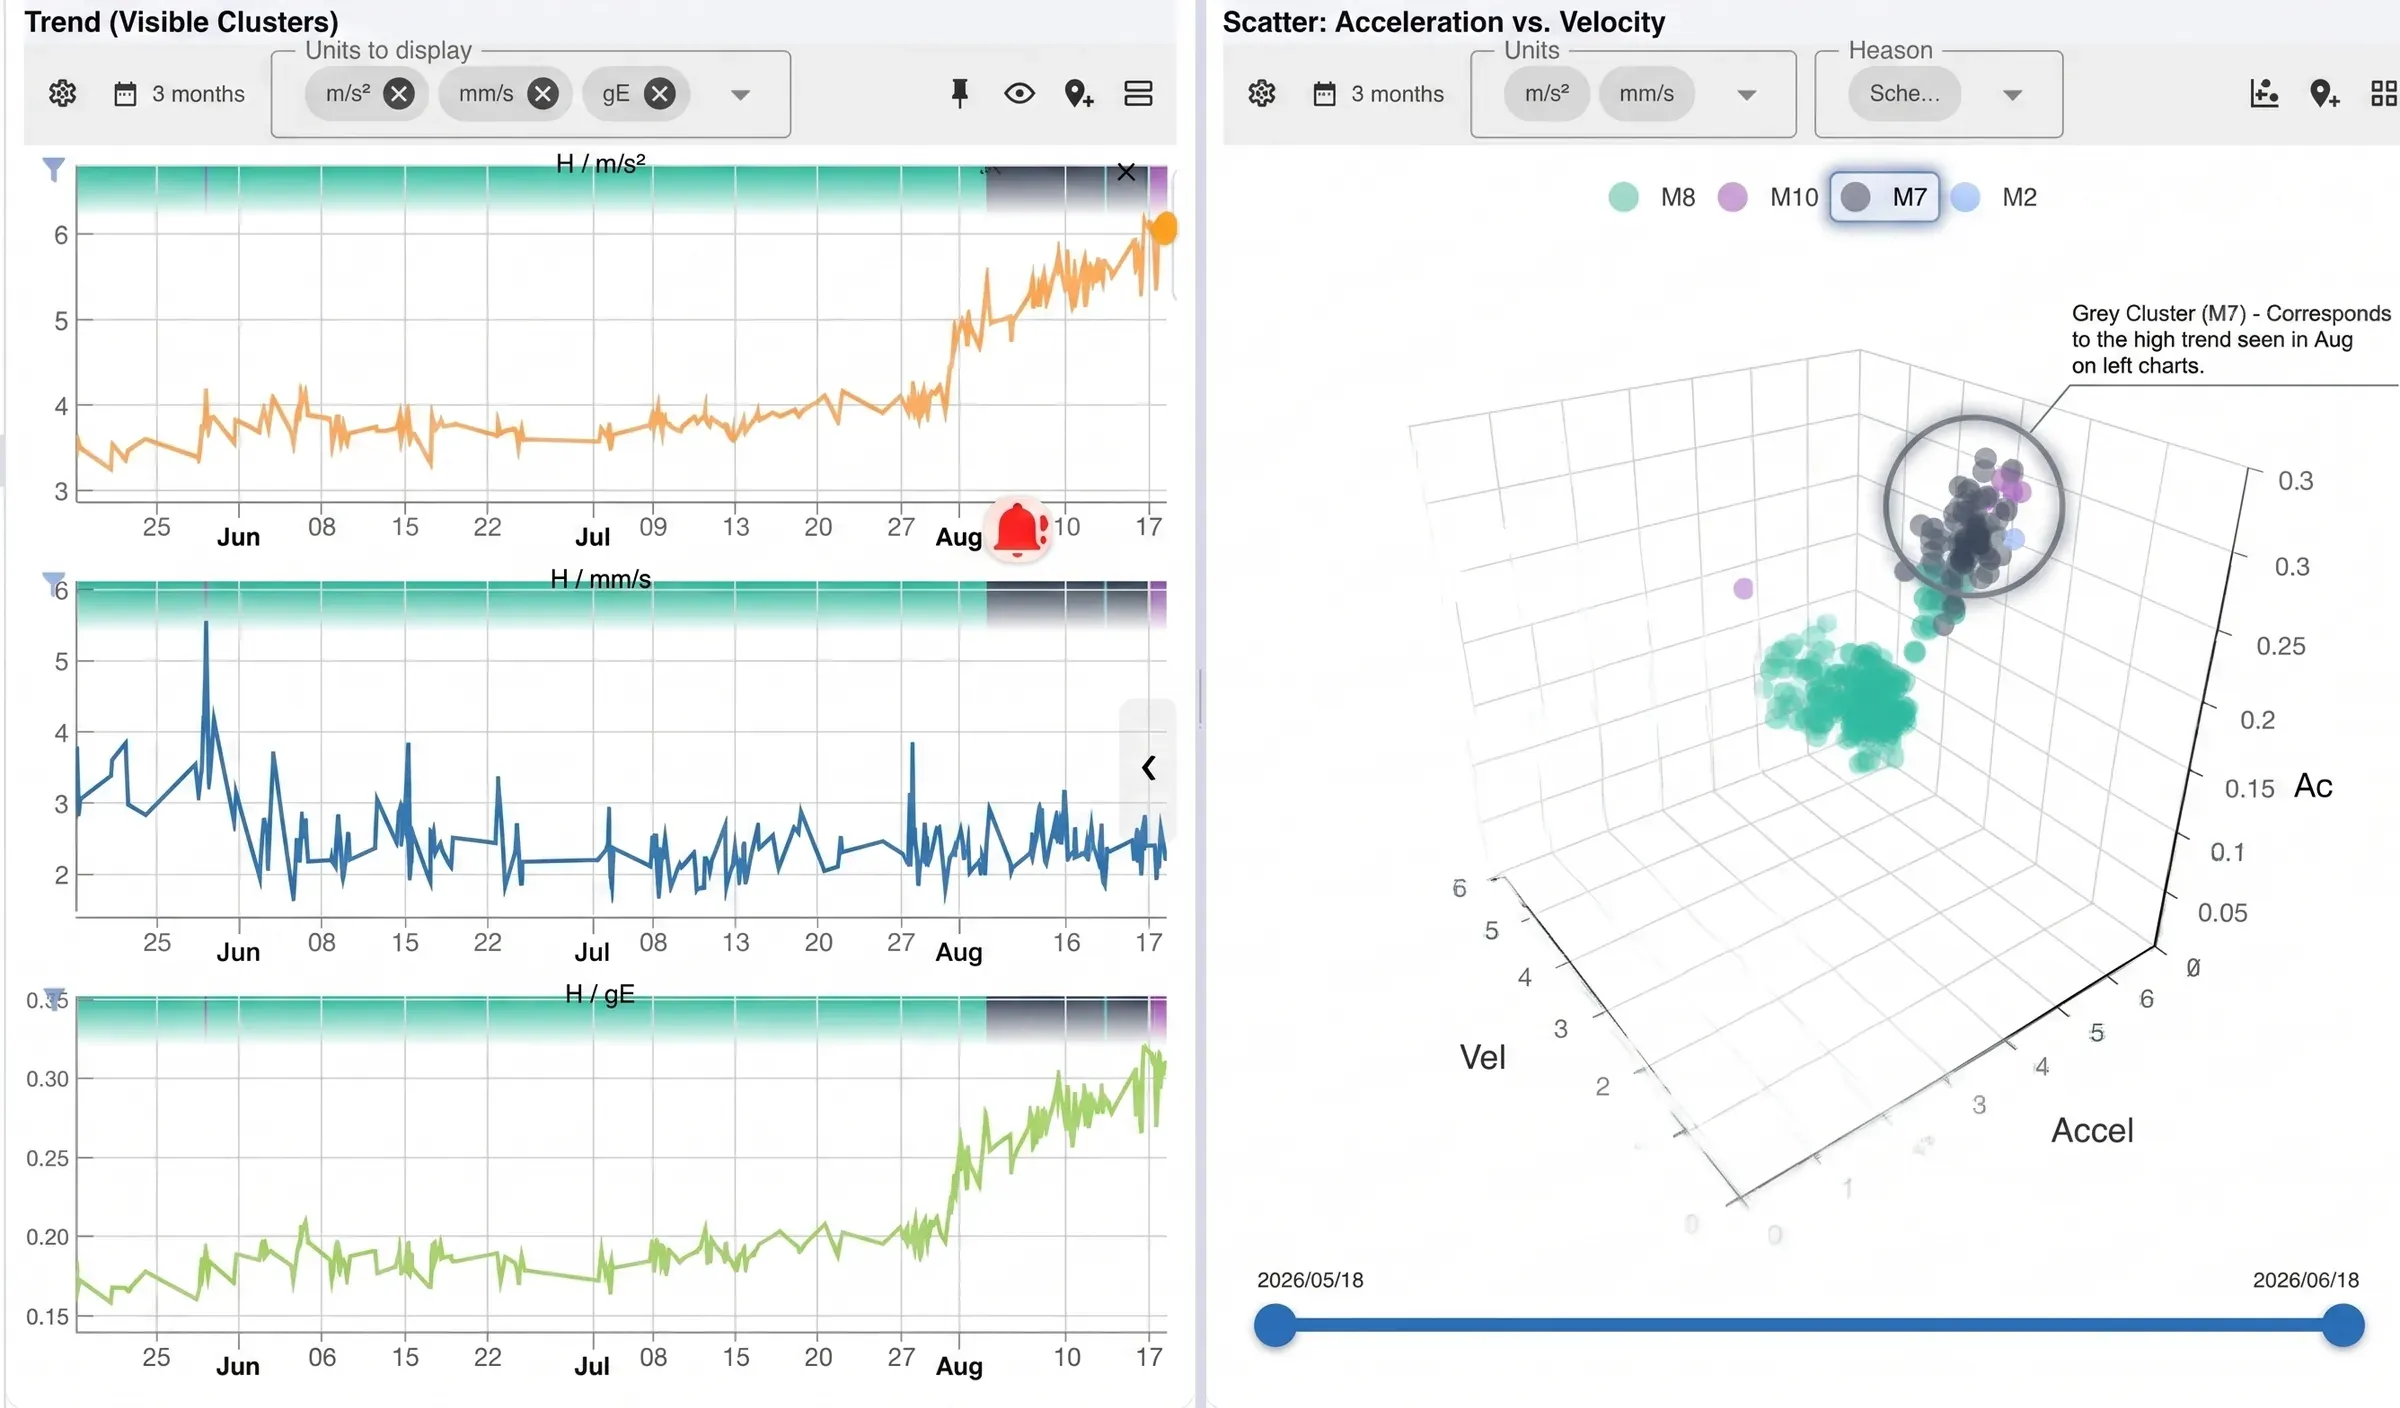
It matters because a real machine does not have one behaviour: it starts, it runs at different loads, it stops. Measured against a single limit, the trend fills with noise until the alarms stop meaning anything.
- BIRCH and MiniBatch K-Means clustering over a feature space that combines velocity, envelope, high and mid frequency energy, and kurtosis.
- A prior split by speed, which separates rotation regimes before grouping within each one.
- Special modes recognized apart: saturated sensor and stopped machine, which would otherwise contaminate the groups.
Every measurement ends up labelled with its mode, and that mode can be trended and plotted as one more unit. A change in behaviour shows up immediately — even when the absolute values never crossed a threshold.
This is the only unsupervised model in Digivibe MX®: the only one nobody has to tell what to look for.
Alarm limits learned from history
Setting alarm limits by hand, point by point and unit by unit, is the most tedious — and most postponed — job in any monitoring program.
Digivibe MX® learns them from the history. You mark a period where the machine was healthy; the software analyzes that window and computes the three levels — yellow, orange and red — for every unit:
- A standard deviation method, which discards outliers before building the threshold, or a maximum method over the learned period.
- Configurable increments per level, with minimum and maximum caps per unit.
- Protection against the classic case: if a unit was never calculated and the whole series is zero, no limits are learned instead of producing permanent alarms.
The resulting limits behave like any other threshold: visible, editable and adjustable point by point.
It names the fault, not just the level
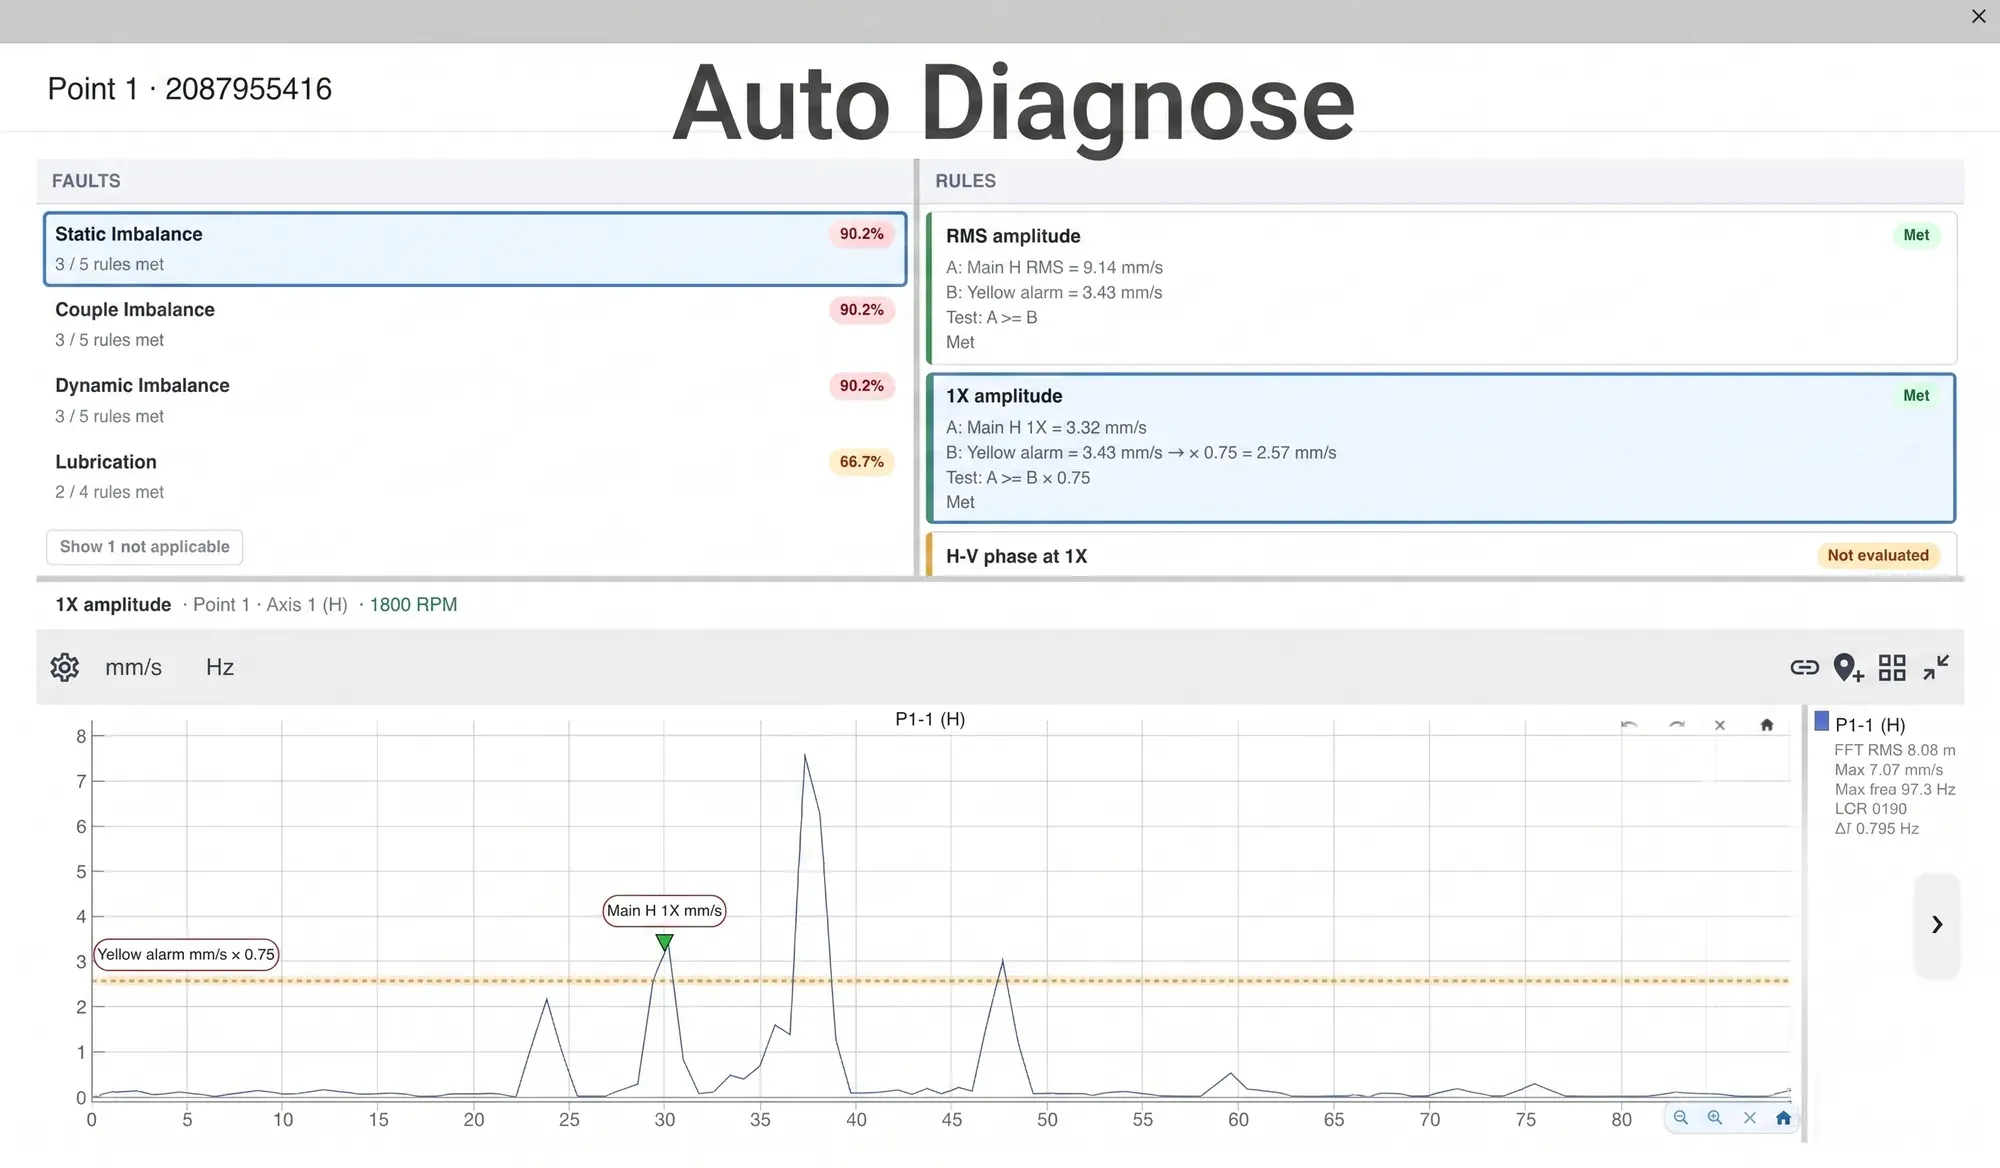
A rule engine evaluates every measurement and classifies the condition of the machine, pointing at the specific fault instead of a generic alarm level.
The diagnosis is not a black box: every fault rests on verifiable conditions — 1X, 2X and 3X amplitude, horizontal-to-vertical phase relation, envelope content, high frequency energy — that you can inspect and adjust. Thresholds, conditions and your own custom faults are configured per point or per machine.
| Category | Faults detected |
|---|---|
| Unbalance | Static, couple and dynamic |
| Misalignment | Parallel and angular |
| Shaft | Bent shaft |
| Bearings | Stage 2, stage 3, stage 4 and cocked bearing |
| Looseness | Looseness in the bearing housing |
| Cavitation | Cavitation in pumps |
| Lubrication | Lubrication failure |
| Status | Machine stopped |
Among others — the catalog is in continuous expansion.
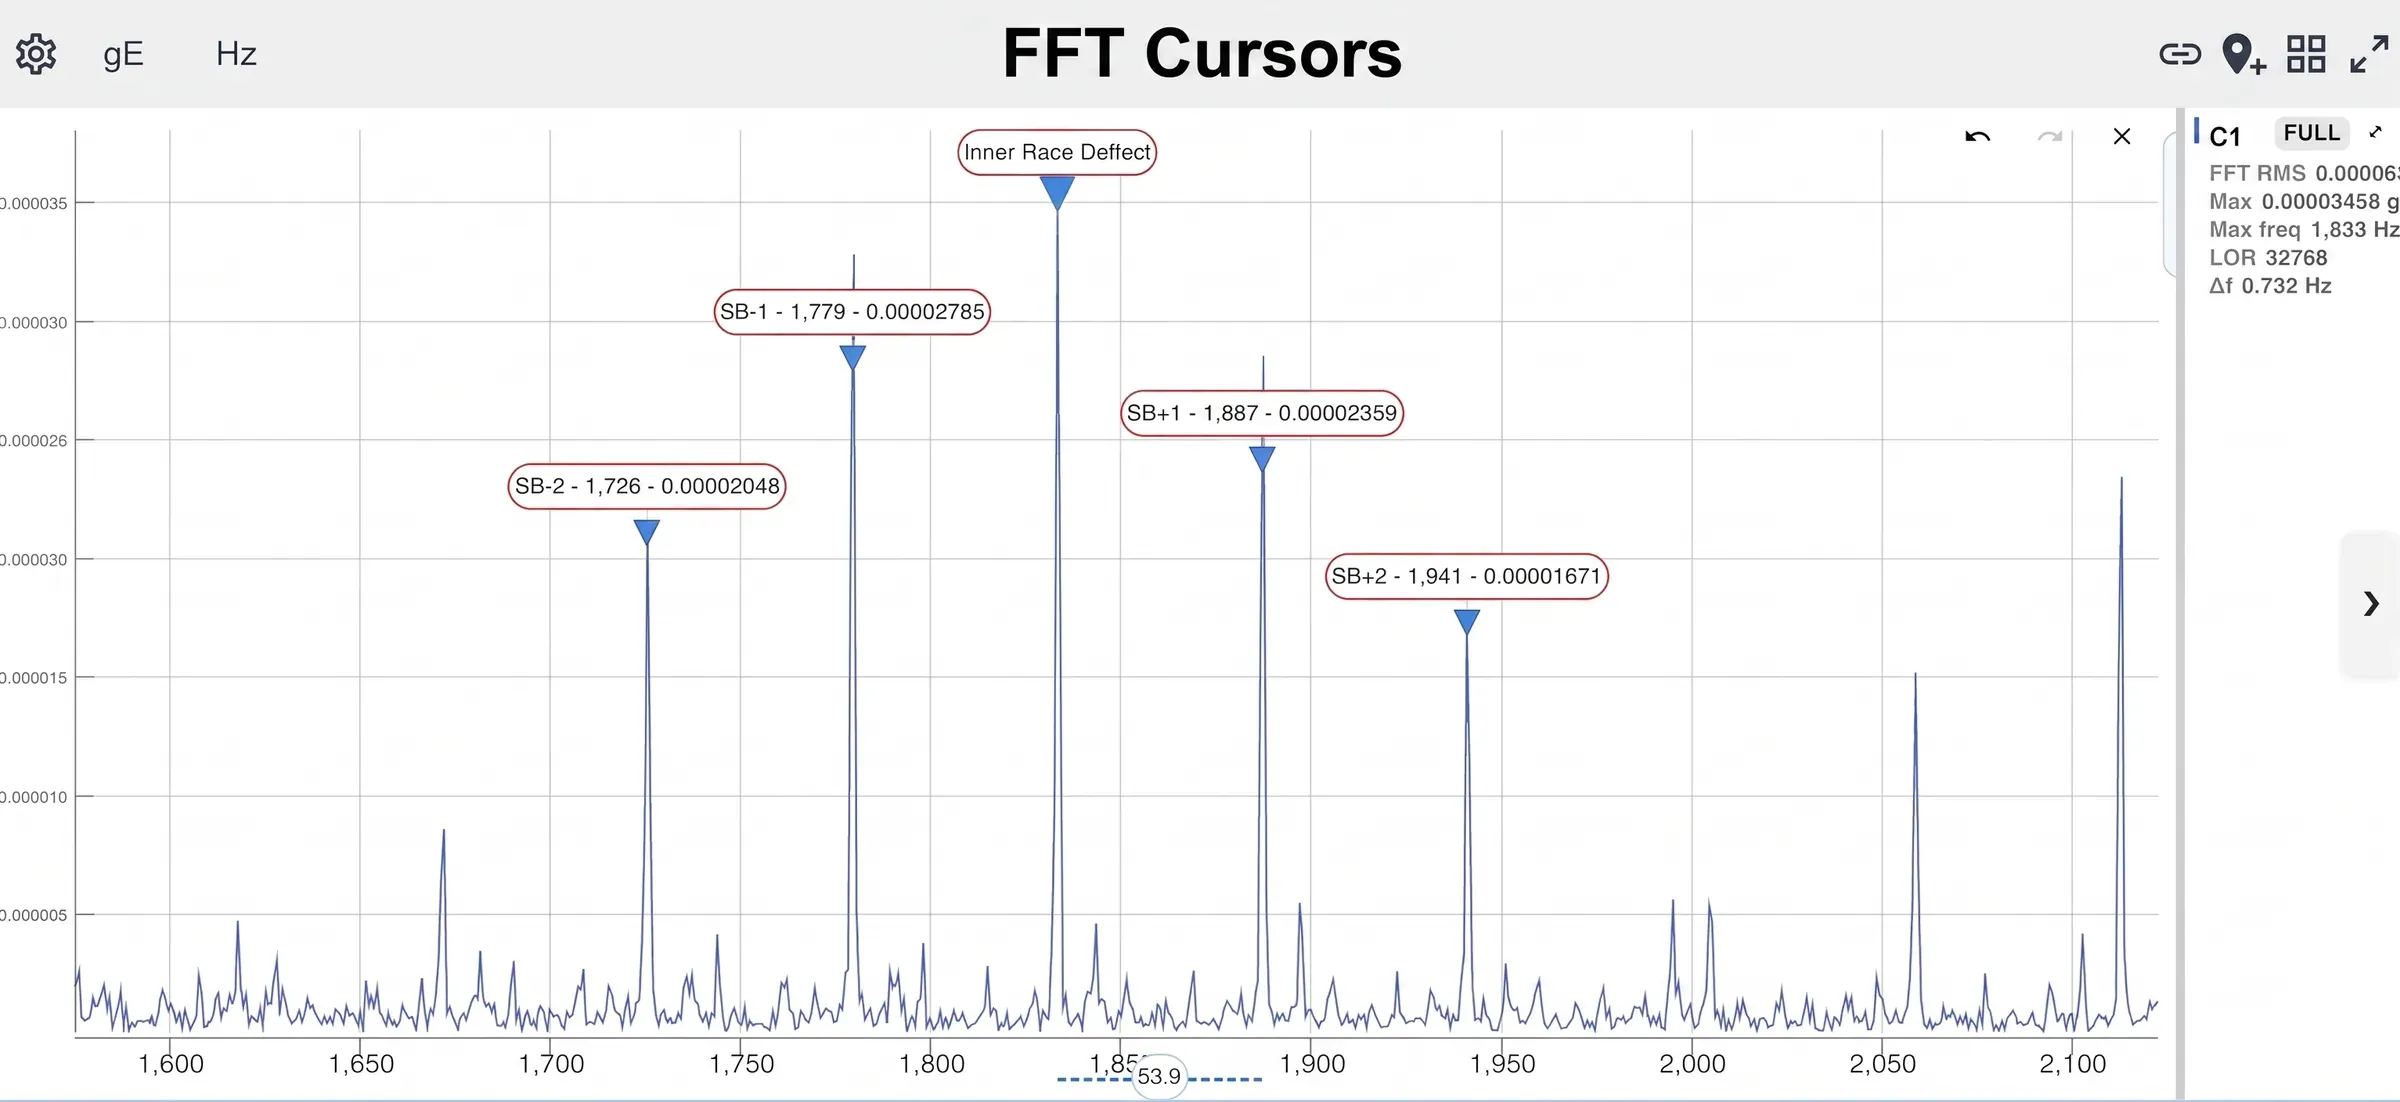
From the raw signal to the named fault
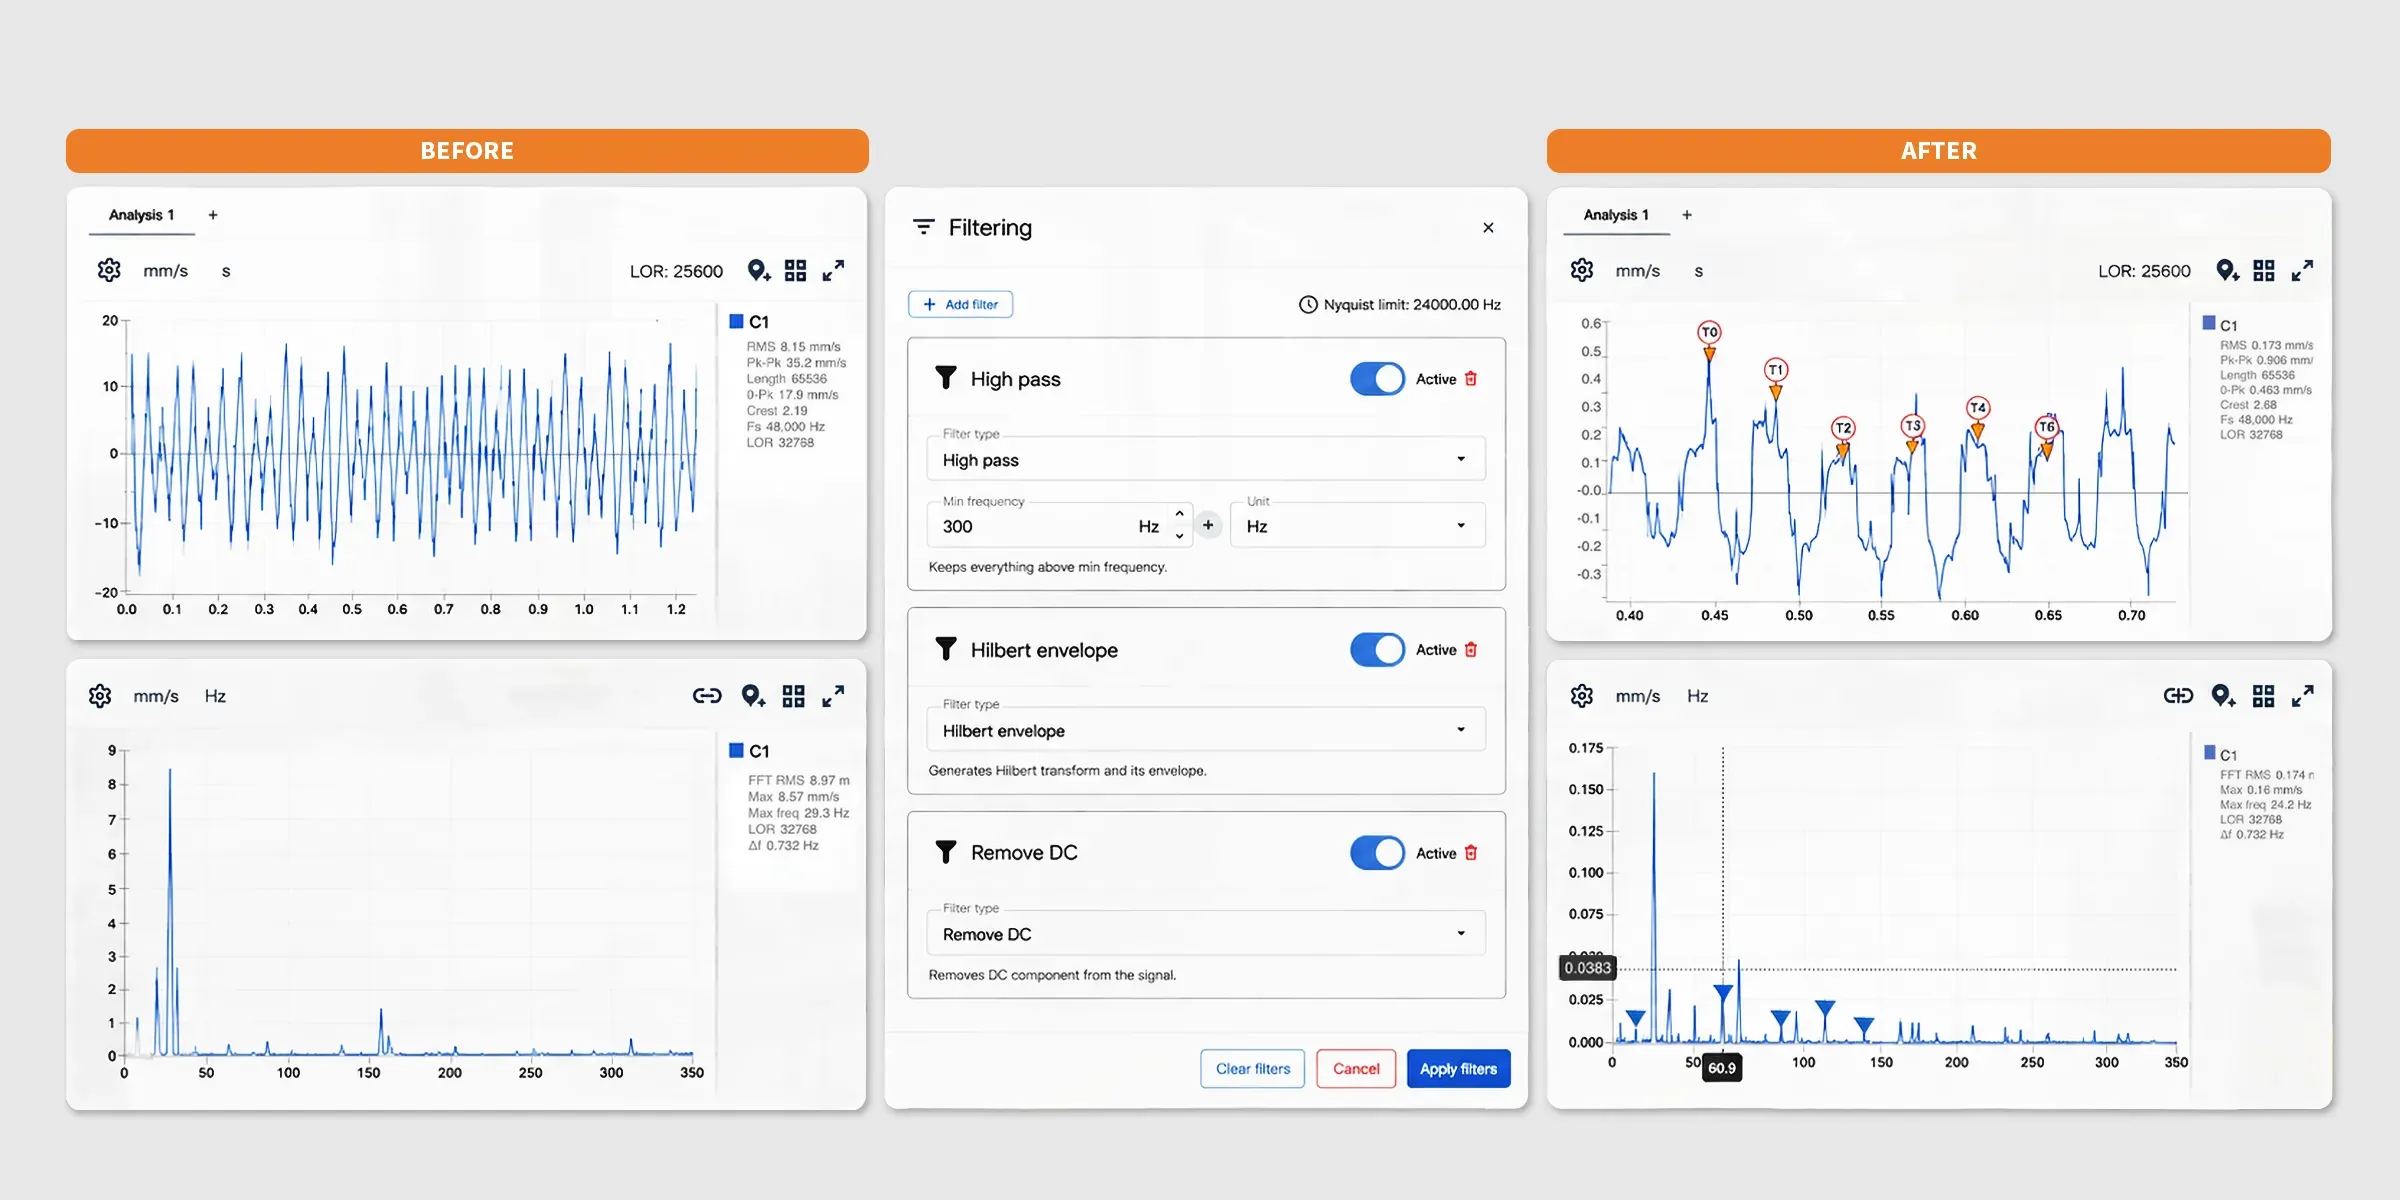
Two steps of the same bearing hunt: first the impacts surface once the noise is filtered away, then the spacing between their sidebands puts a name on the fault.
The impacts surface
The spacing names the fault
Cases: the machine’s clinical history
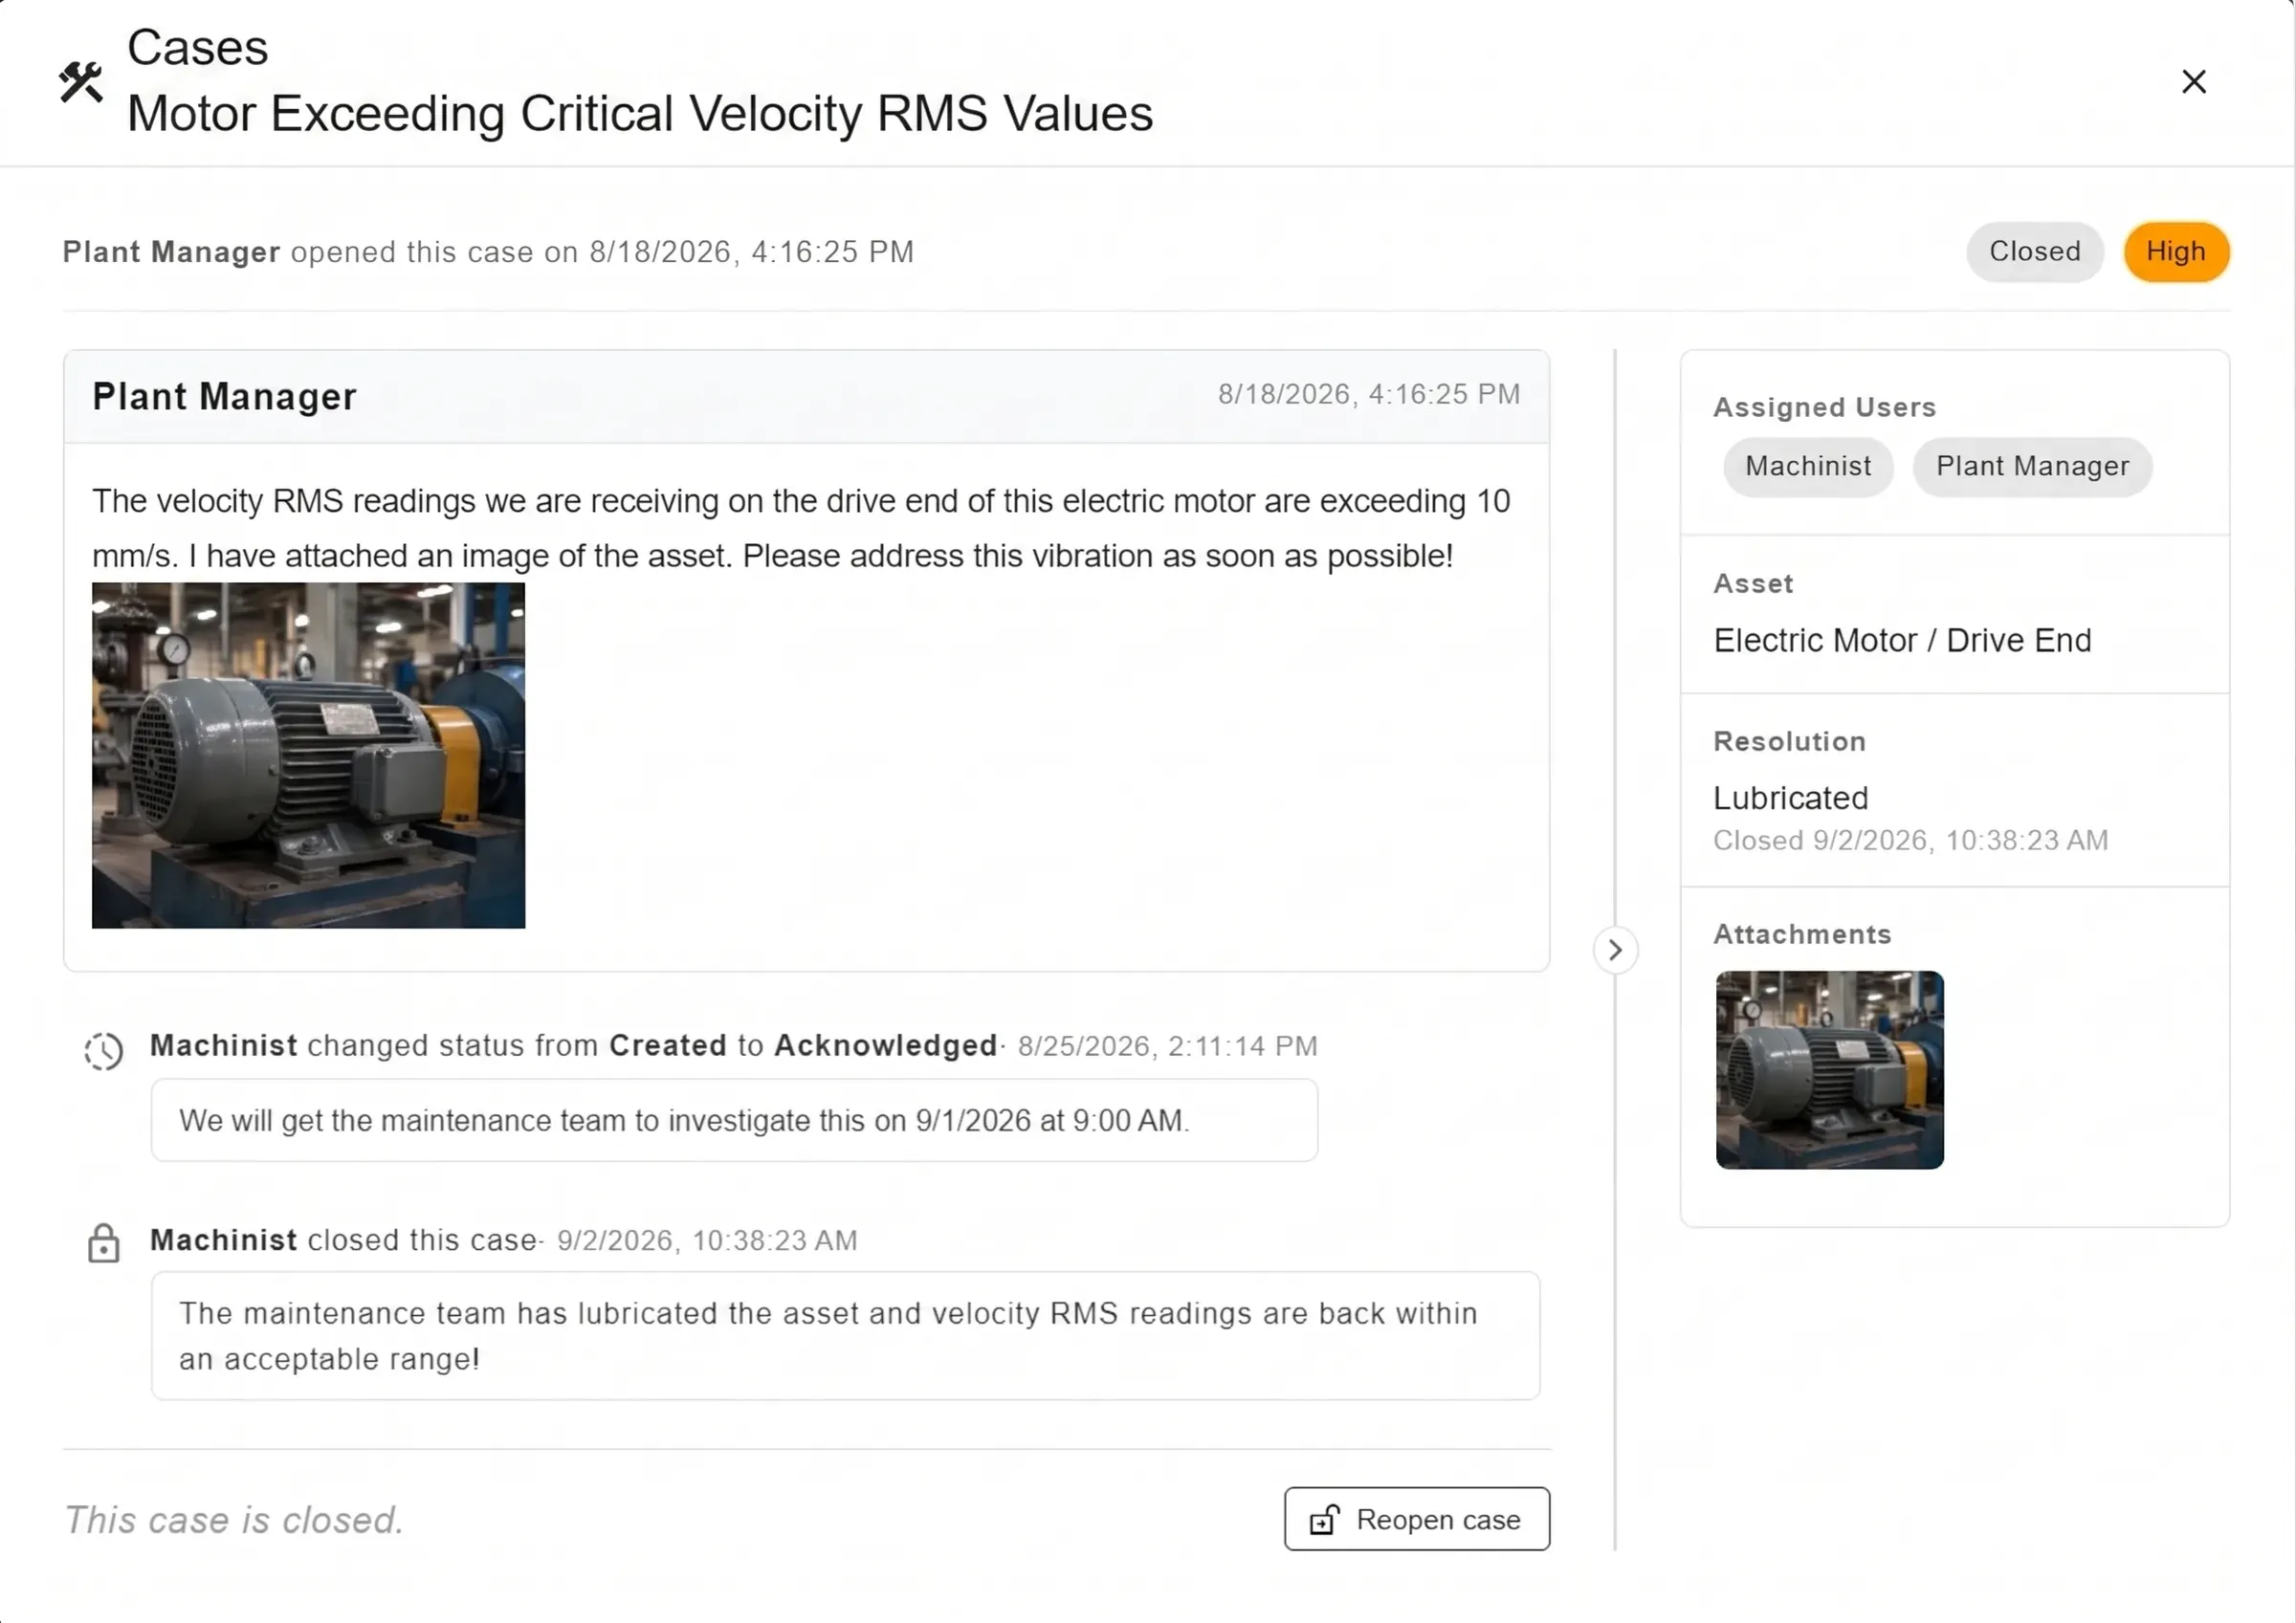
Detecting the fault is half the job. The other half is someone attending to it, a record of what was done, and the knowledge not getting lost.
That is what Cases are for.
The spectrum, the photo of the coupling and the conversation live in the same place — and the case records what finally fixed it.
| Field | Detail |
|---|---|
| Asset | The case is tied to the machine, point or axis where the condition was found |
| Priority | Low, Medium, High and Critical, color coded |
| Status | Configurable flow, with a permanent closing status |
| Owners | One or more assigned users; the table filters by person |
| Resolution | Ready-made catalog — lubricated, repaired, part replaced, adjusted or recalibrated, resolved by maintenance, no fault found, will not fix, deferred to scheduled maintenance — plus free text |
Conversation and evidence. A comment thread with a rich text editor, in chronological order. Private comments, visible only to users with permission on the case, so the internal discussion stays internal. Attachments up to 4 MB — photos, PDF, Word, Excel, CSV and text — so the coupling photo, the work order and the vibration report live in one place. And a timeline recording every status change, who made it and when.
Collaboration beyond the software. A case can be shared with someone who has no account — the plant manager, the contractor, the equipment manufacturer. They get a tokenized link that opens the case in a browser, with nothing to install and no access to the rest of the database. The link is revocable and it expires. Notification emails link straight to the case, identifying the right database on the way.
Trends: where you see it coming
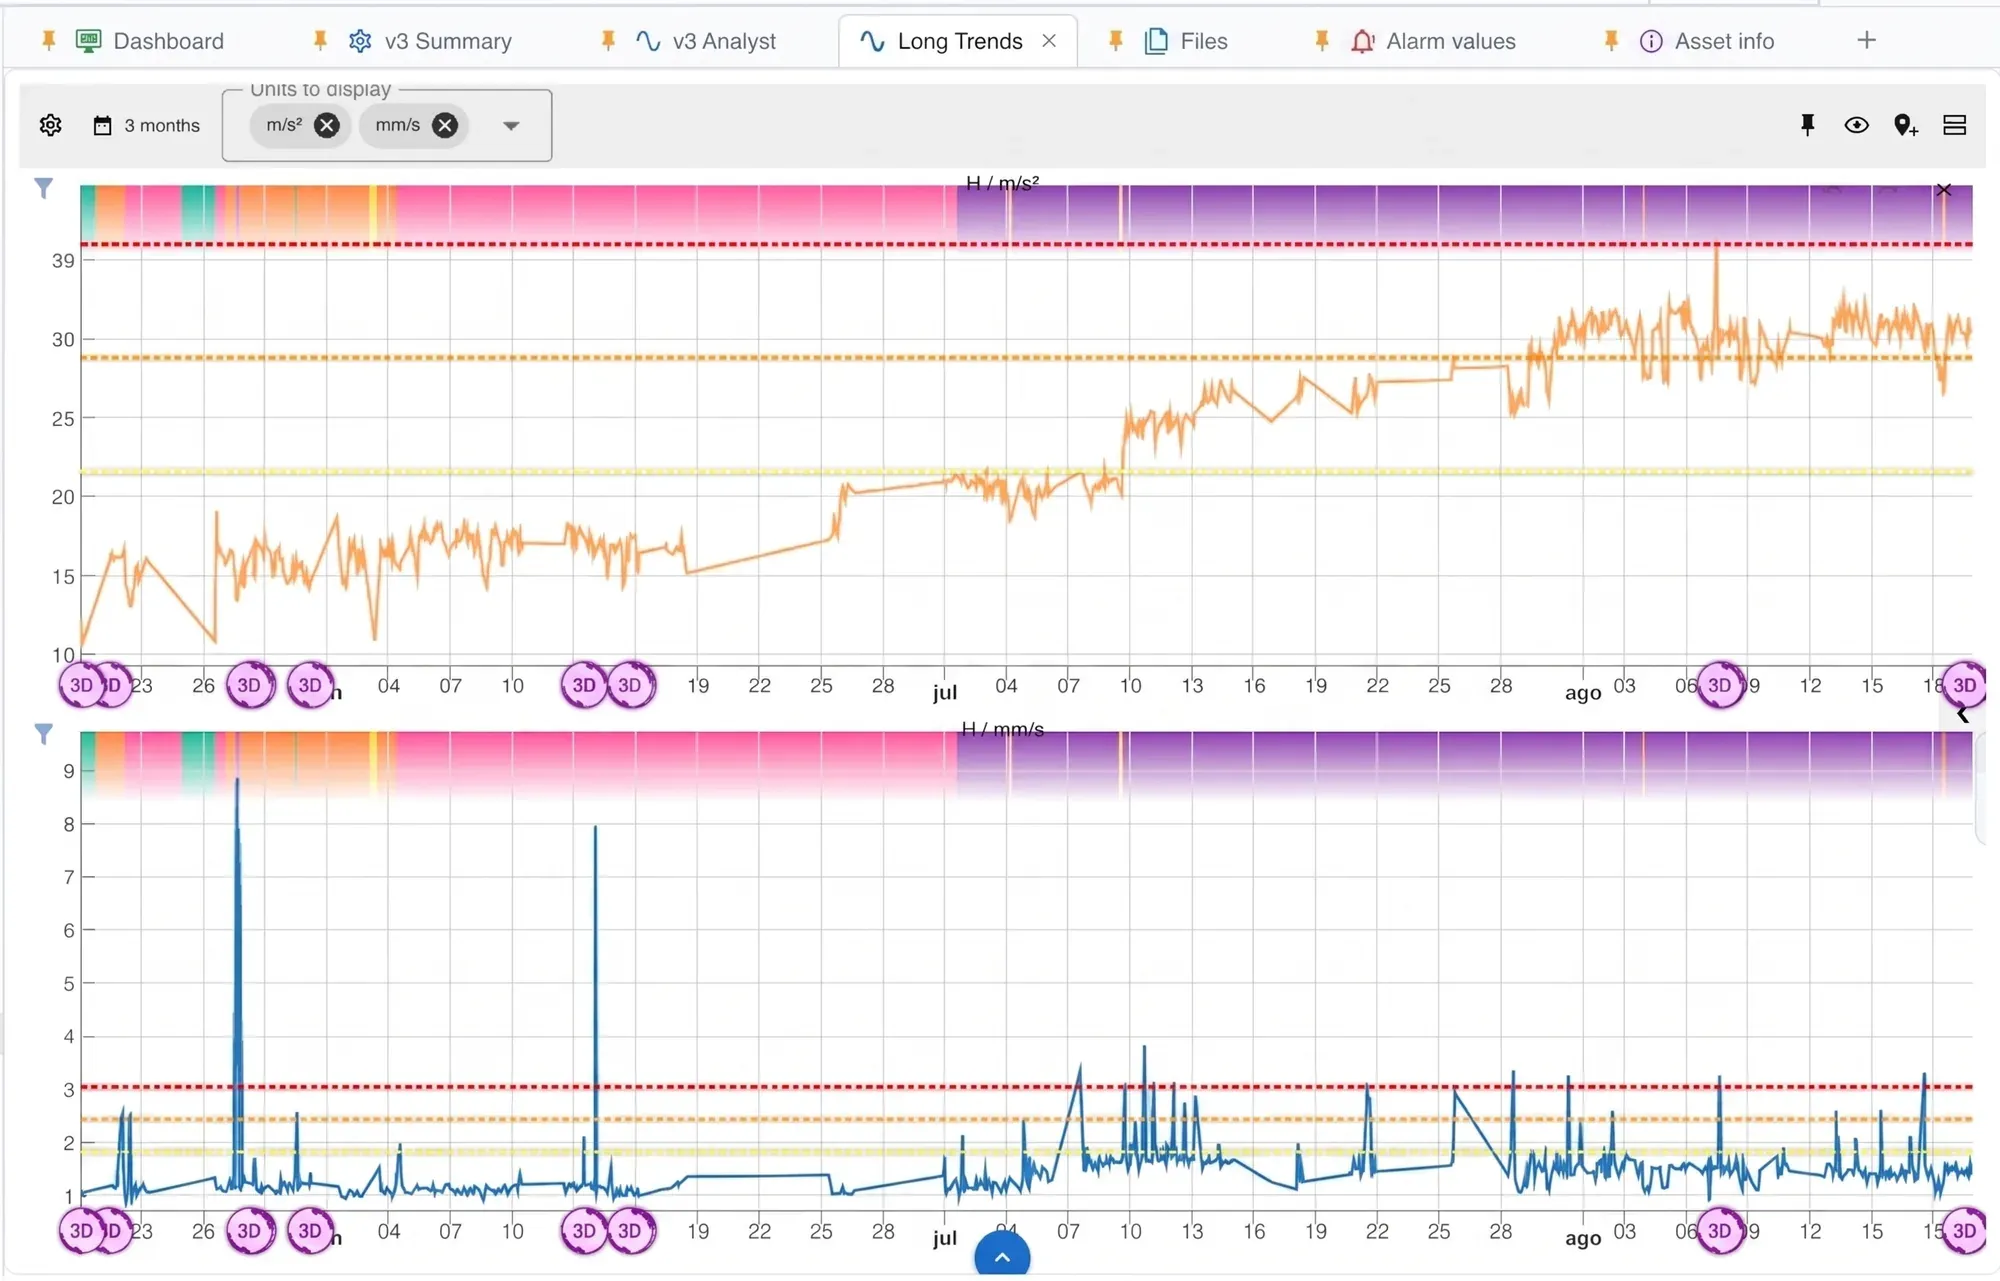
- Several units on the same chart — acceleration, velocity, envelope, temperature, current, RPM — each with its own scale.
- Preset ranges (7 days, 30 days, 3, 6 and 12 months) or the exact period you need.
- Alarm bands drawn over the series, so severity reads without consulting a table.
- Synchronized multiple trends: several panels sharing the time axis, to correlate points and axes of the same machine.
- Scatter between two units, to find relationships the time series hides.
- From any point on the trend you open the original measurement: the spectrum and the waveform that produced that value.
Routes, and the phone in your pocket

Routes are configurable by plant, area and machine, with their walking order. Collection runs from the local interfaces or straight from the wireless sensors, and syncs automatically to the database and the cloud.
QR Connect transfers routes and files between the desktop and the mobile app with no cables and no network setup.
The WiSER VIBE® app carries the route in the field, shows the reading in progress and pushes the data to the same dashboard you use at your desk.


Correcting, not just measuring
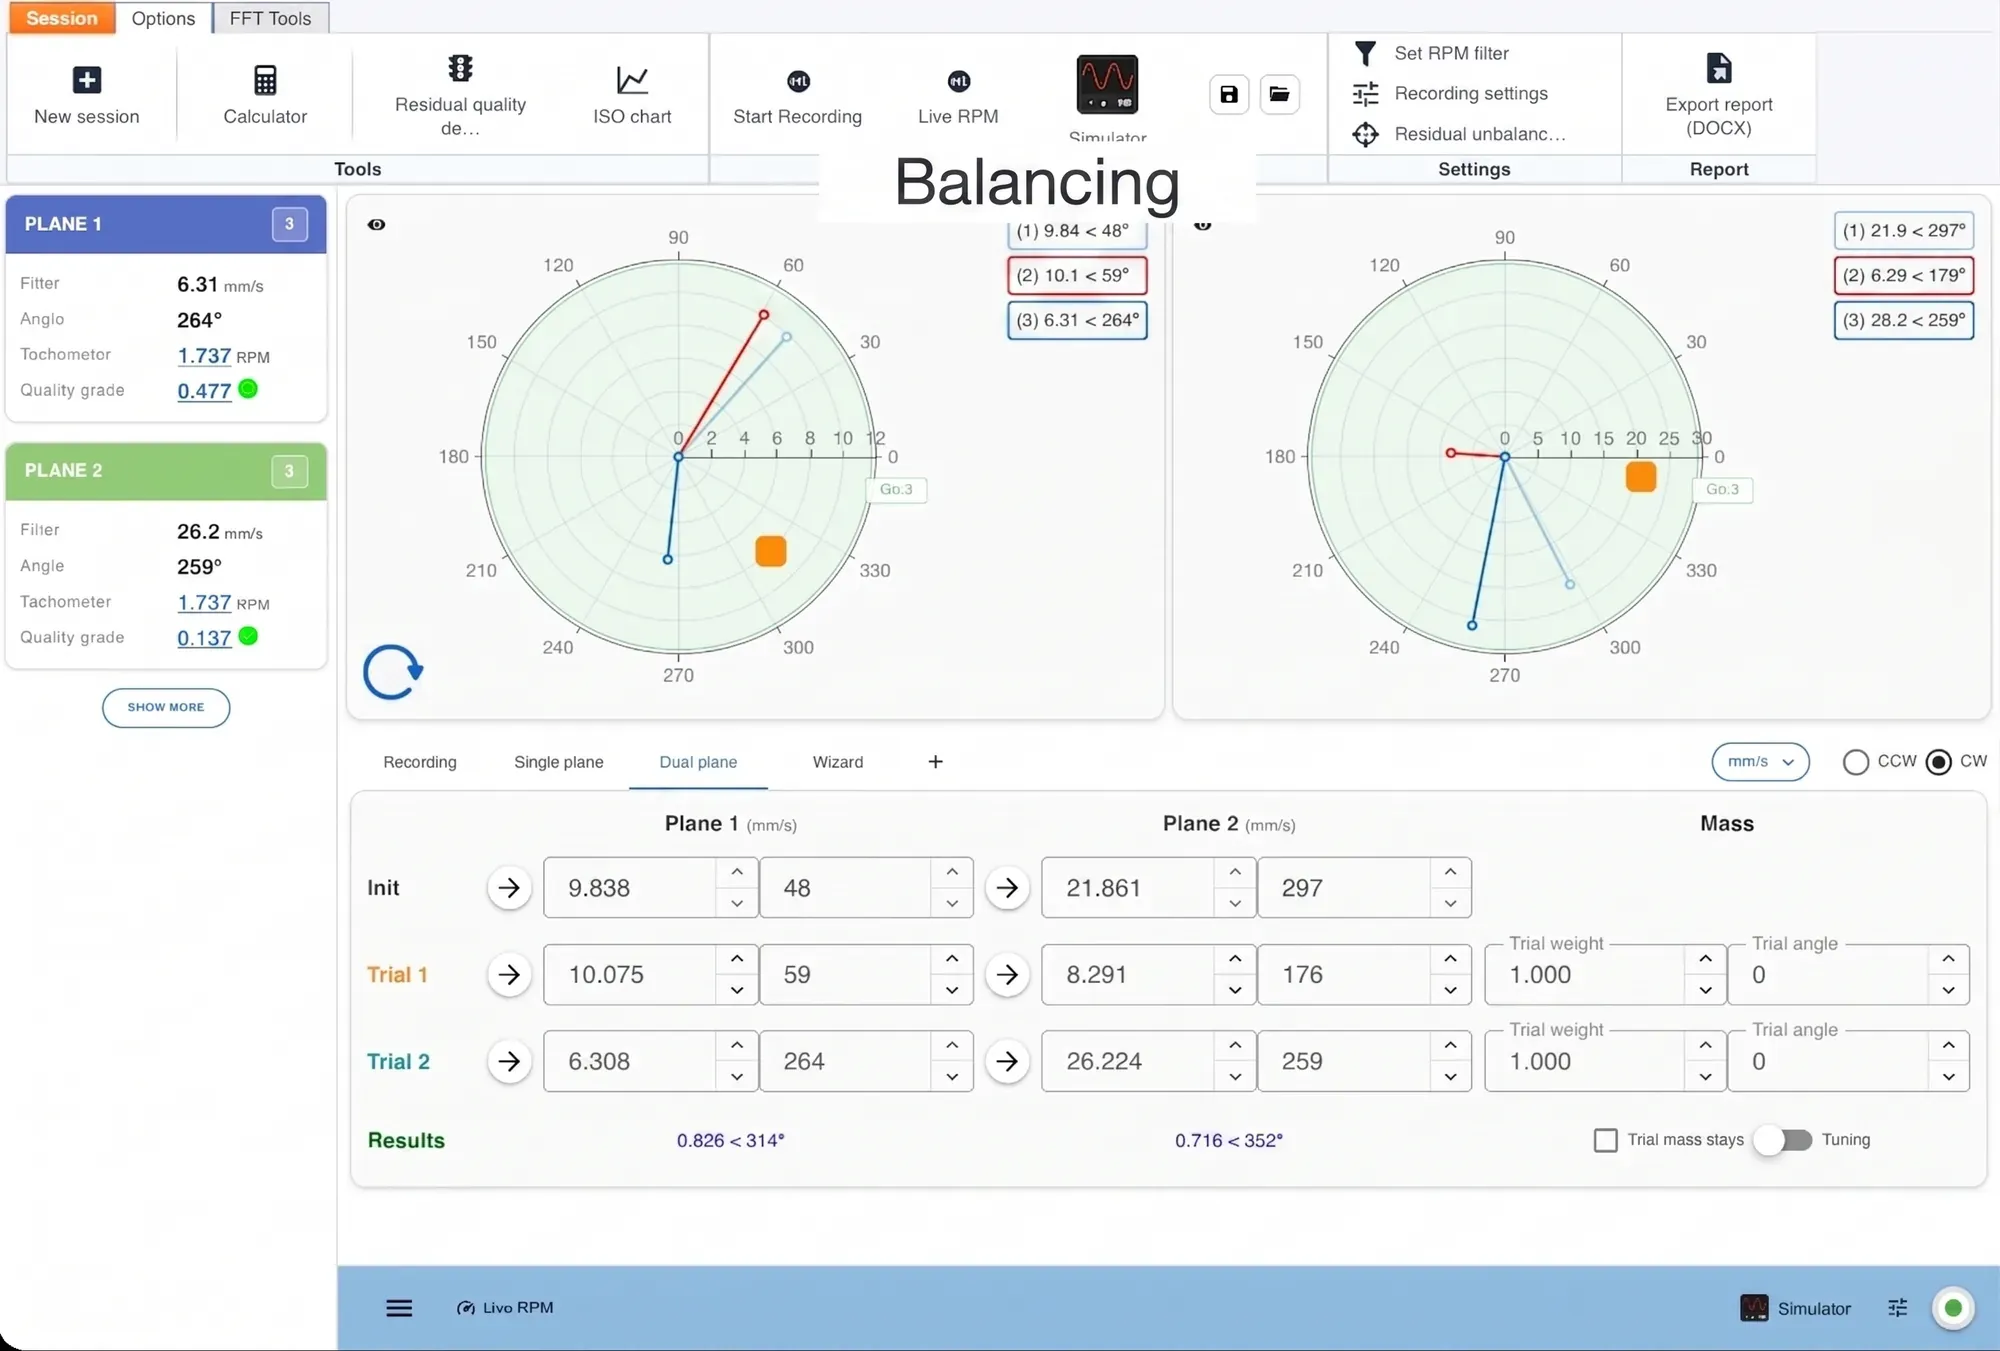
Field balancing
Balancing in 1, 2 and 3 planes with a step-by-step wizard, correction weight and angular position, polar diagram of the runs, and a report ready to hand over.
ODS and modal analysis
ODS — Operating Deflection Shapes shows how the machine actually deforms while it runs. The animation over the 3D model, at the frequency you select, turns an abstract spectrum problem into something anyone on the plant floor understands at a glance.
Modal analysis by impact hammer gives FRF, coherence, natural frequencies and damping — so you can tell a force problem from a resonance problem before paying for the wrong repair.
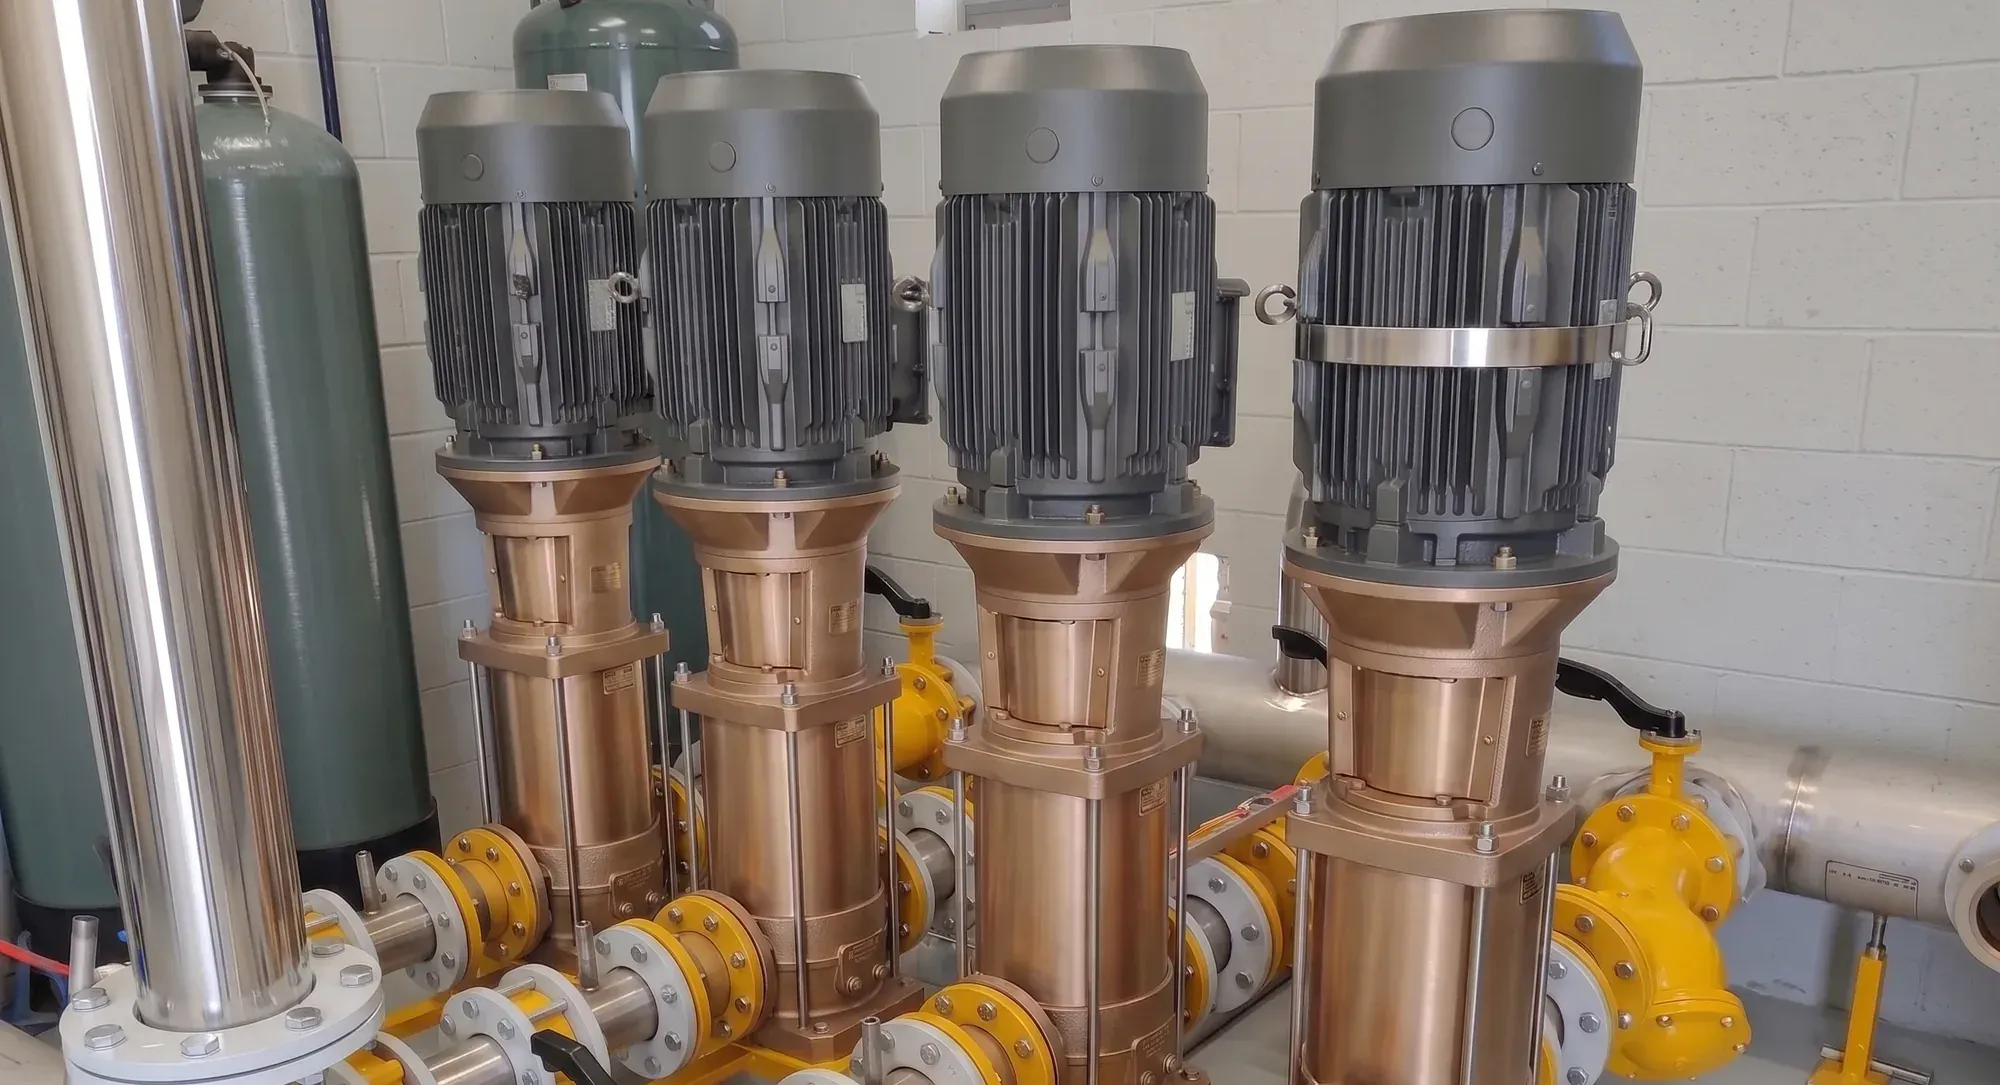
The machine, and the shape its vibration draws while it runs.
Four versions
Pick the one that matches the job
The license is yours, not the computer’s: if the tablet breaks or the PC is replaced, the software installs on the new one at no extra cost.
M10
Balancing and field analysis
For the technician who balances on site and needs to diagnose with the spectrum in hand.
M20
Analysis and monitoring
The complete analysis version: route collection, automatic diagnosis, modal analysis, ODS and the cloud. No balancing module.
M30
Everything included
M20 plus the complete balancing module.
PHANTOM®
Analysis from the cloud
An M20 for the remote analyst: it works on the data your PHANTOM® sensors already uploaded to EI-Analytic™. No direct acquisition. Free with any PHANTOM® kit.
Compare the four versions
✔ included · — not included
| M10 | M20 | M30 | PHANTOM® | |
|---|---|---|---|---|
| Acquisition | ||||
| GX-400, WiSER and Defiant local interfaces | ✔ | ✔ | ✔ | — |
| PHANTOM® wireless sensors | — | ✔ | ✔ | — |
| Route collection | — | ✔ | ✔ | — |
| Off-route analysis (ad-hoc measurement) | ✔ | ✔ | ✔ | — |
| QR Connect (route and file transfer with the mobile app) | — | ✔ | ✔ | ✔ |
| Analysis | ||||
| FFT, waveform and markers | ✔ | ✔ | ✔ | ✔ |
| Advanced FFT tools (filtering, FRF, coherence and more) | ✔ | ✔ | ✔ | ✔ |
| Waterfall and orbit plots | ✔ | ✔ | ✔ | ✔ |
| Automatic fault diagnosis | — | ✔ | ✔ | ✔ |
| File explorer and outlier detection | ✔ | ✔ | ✔ | ✔ |
| Report generation | ✔ | ✔ | ✔ | ✔ |
| Specialized modules | ||||
| Balancing in 1, 2 and 3 planes with wizard | ✔ | — | ✔ | — |
| ODS — Operating Deflection Shapes | — | ✔ | ✔ | ✔ ¹ |
| 3D model editor and measurement point placement | — | ✔ | ✔ | ✔ |
| Modal analysis (impact hammer, FRF, natural frequencies) | — | ✔ | ✔ | — |
| Cloud and management | ||||
| EI-Analytic™ cloud connection | — | ✔ | ✔ | ✔ |
| Monitoring dashboards | — | ✔ | ✔ | ✔ |
| Custom dashboards | — | ✔ | ✔ | ✔ |
| Notifications and alarms | — | ✔ | ✔ | ✔ |
| Cases and collaboration | — | ✔ | ✔ | ✔ |
| Multiple databases, roles and users | — | ✔ | ✔ | ✔ |
¹ In the PHANTOM® version, ODS works on the recordings your PHANTOM® sensors already uploaded to the cloud.
Digivibe MX® technical specifications
| Simultaneous channels | 4 — three axes plus one channel from EI WiSER® 3X, or four wired channels from the GX-400 · 8 to 16 with DEFIANT™ |
|---|---|
| Lines of resolution | Over 2,000,000 — set by the length of the recording, not by the instrument |
| Sample rate | 48,000 Hz with EI WiSER® 3X and GX-400 · 96,000 Hz per channel with DEFIANT™ |
| Frequency range | 0.5 Hz to 24 kHz with the GX-400 · 0.5 Hz to 10 kHz (±3 dB) with EI WiSER® 3X · 0.5 Hz to 25 kHz with DEFIANT™ |
| Analog-to-digital conversion | 24-bit, 20 g dynamic range (EI WiSER® 3X) |
| Measurement ranges | Acceleration 0.0001 to 100 g peak-to-peak · velocity 0.002 to 3,000 mm/s · displacement 0.5 µm to 30 mm |
| Measurement parameters | Acceleration, velocity, displacement and acceleration envelope · peak, peak-to-peak and RMS |
| FFT windows | Rectangular, Hann, Hamming, Flat Top and Blackman |
| Bearing database | More than 25,000 bearings with their fault frequencies |
| Acquisition interfaces | EI WiSER® 3X (Wi-Fi, triaxial), GX-400 (USB, 4 channels), DEFIANT™ (8 to 16 channels) and PHANTOM® wireless sensors |
| Mobile app | WiSER VIBE® for iOS and Android, unlocked by the same licence |
| Desktop platforms | Windows, macOS and Linux |
| Licence | Yours, not the computer's — reinstalls on a new PC or tablet at no cost |
| Data access | Modbus, MQTT and OPC · cloud API · local backup tools |
| Data storage | Open standard databases — SQL Server, MySQL and Azure |
| Included in every version | FFT, waveform and markers · advanced FFT tools (filtering, FRF, coherence) · waterfall and orbit plots · file explorer and outlier detection · report generation |
The figures for each interface are in their own datasheets: EI WiSER® 3X, GX-400 and DEFIANT™.
Runs where you work
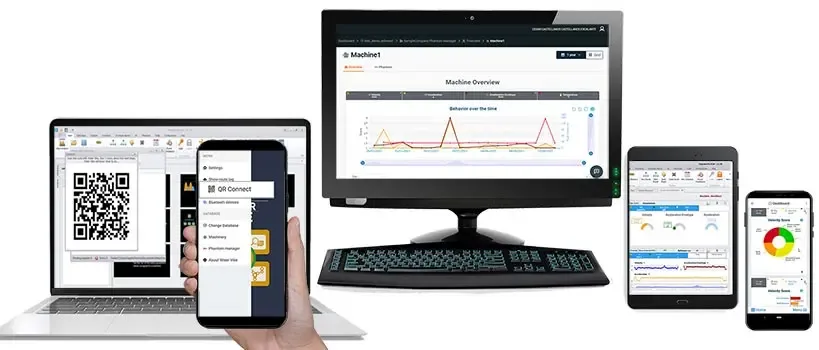
Digivibe MX® is a lightweight application: it runs on standard desktop, laptop and tablet hardware, with no special processor or memory requirements.
| Desktop | Windows, macOS and Linux |
| Mobile | iOS and Android |
| Cloud | Syncs with the EI-Analytic™ platform |
| Internet connection | For activation only |
| Languages | English, Spanish, French and Portuguese |
Frequently asked questions
What is the difference between Digivibe MX® and WiserVibe?
They are the same application on two platforms, sharing the same analysis code. Digivibe MX® runs on Windows, macOS and Linux computers and WiserVibe on mobile. What changes is the screen and the moment of use: the phone to collect in the field, the PC to analyse sitting down.
What do I need to use Digivibe MX® as a portable vibration analyzer?
The software, a tablet or laptop, and one interface: EI WiSER® 3X for wireless or GX-400 for cables. That is the complete instrument, with four simultaneous channels either way. The same licence unlocks WiSER VIBE® on your phone, so you can walk the route with the phone and the wireless sensor, then open the same database on the tablet for the deep analysis. If the tablet breaks or the PC is replaced, the licence installs on the new one at no extra cost.
How many channels and lines of resolution does Digivibe MX® have?
Four simultaneous channels and more than 2,000,000 lines of resolution. The channels come from the interface — three axes plus one channel from the EI WiSER® 3X, or four wired channels from the GX-400 — and DEFIANT™ extends that to 8 or 16 for continuous monitoring. Because the FFT runs on the computer, lines of resolution are set by how long you record, not by the instrument, so you do not have to reduce the frequency range to separate two close frequencies.
Can I work without an internet connection?
Yes. Digivibe MX® works with local files and databases; the cloud is optional. Route collection also works without signal — the data uploads when the device gets a connection back.
How do I build collection routes?
Routes are created in Digivibe MX®, in EI-Analytic™ or in WiserVibe, and can be stored in the cloud or locally.
In the cloud: you download them in WiserVibe, collect with the EI WiSER® 3X or the GX-400, and when you finish the data uploads on its own to build trends and automatic diagnoses.
Locally: routes travel from Digivibe MX® to WiserVibe through a QR code that connects the two devices. When the route is done, the same QR connection brings the data back to Digivibe MX®.
Can I see machine run-ups and coast-downs?
Yes. The software plots the run-up / coast-down curve so you can see how amplitude and phase change with speed — which is how a resonance gets identified instead of argued about.
What kind of algorithm does the automatic diagnosis use?
A proprietary algorithm that works much like a neural network, and that lets users add their own diagnoses or modify the existing ones.
Do you use neural networks?
The automatic diagnosis is a proprietary system that works in a very similar way. Erby, the assistant, is a separate layer on top: a language model that reads the context the software prepares for it — datasheet, trends, spectrum, waveform, sensor health, analysts’ notes — and returns a verdict you verify.
What is Erby?
Erby is the AI assistant built into EI-Analytic™ and the Digivibe MX® suite. It explains the software and opens the right screen, registers a machine from a photo of its nameplate, builds dashboards, synthetic signals and filter chains from a description, diagnoses with evidence you can check, and remembers how you like to work. It is priced as a service, and every answer shows what it cost.
Does my data leave my platform when I use Erby?
No. Erby works on the data inside your platform, and it only acts when you confirm.
Is Erby trained on other companies’ machines?
No, and it does not need to be. The general knowledge of vibration analysis — fault frequencies, standards, failure patterns — is published, and the language model already carries it. What decides whether an answer is right is the context of your machine: its datasheet, operating modes, trends, spectrum, waveform and the analysts’ notes. That context is assembled from your own database, shown to you before it is sent, and can be anonymised first. More on this here.
How is the probability of each diagnosis calculated?
From the rules that each fault triggers, and from the positive and negative predictive values of each one.
Do you have modal analysis tools?
Yes, and it is full modal analysis.
Modal analysis with an instrumented hammer. The software captures the hammer sensitivity (mV/N), averages several impacts using H1, and produces a calibrated FRF for every response channel with its coherence. It includes double windowing — force gate and exponential — reports the damping of each mode, and only looks for peaks where the hammer actually excited the structure and where coherence is high enough. Results export to UFF 58.
We do not sell the instrumented hammer: you supply it. The software works with any hammer that outputs a force signal and whose sensitivity is known.
ODS — Operating Deflection Shapes, with the GX-400 (a triaxial or uniaxial accelerometer plus a reference sensor) or with the EI WiSER® 3X (triaxial plus optical reference). It gives the deflection shape in operation, amplitude and phase, and identifies resonances and structural problems.
Natural frequencies by impact, if you do not have an instrumented hammer at hand: you excite the structure with any hammer and measure the response with the reference sensor. It does not give a calibrated FRF, but it is a practical way to identify them.
What file formats does it handle?
Its own — signals, balancing jobs, rotors, routes, dashboards, 3D models, and ODS and modal sessions — plus UFF 58 to exchange with other analysis programs.