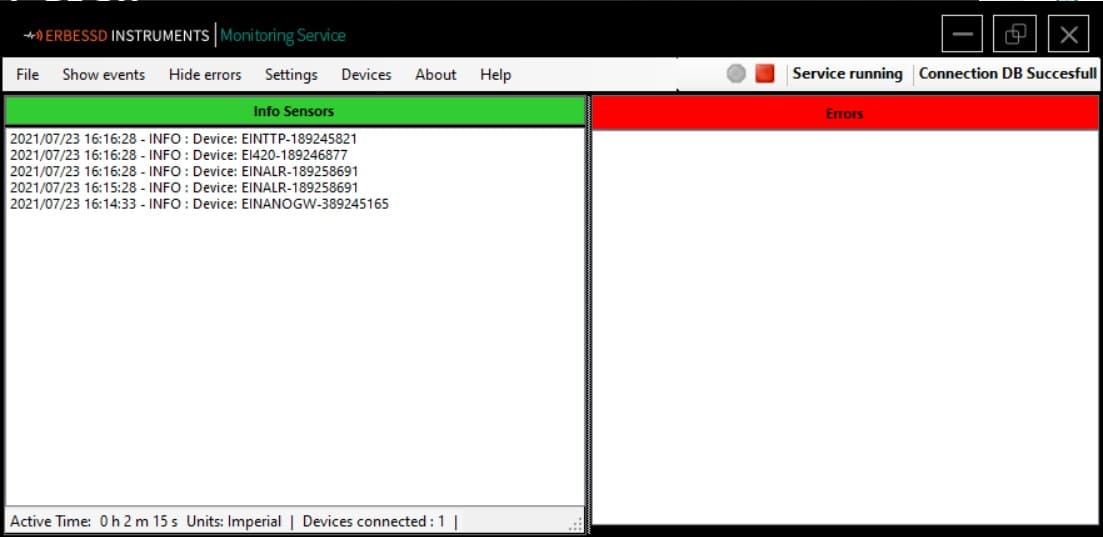
Erbessd Instruments Monitoring Service
The EI Monitoring Software is the link for data collection between the Gateway and Erbessd Instruments Devices. Here we can precisely visualize received information by our Phantom Sensors. We can visualize both the data collected and the configurations of the sensors themselves.
Similarly, the EI Monitoring Service is the software that integrates the Modbus service with the Phantom devices,
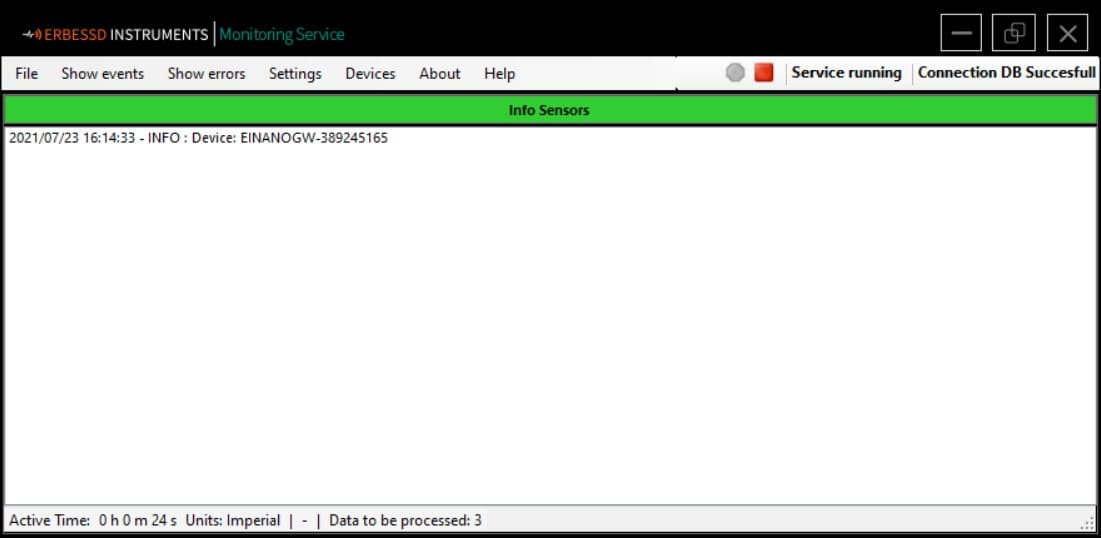
We will now explain the basic functions of the EI Monitoring Service. It should be noted that it is important to have done the initial configuration of the Gateway device to be able to receive data from our Phantom sensors.
File Menu.
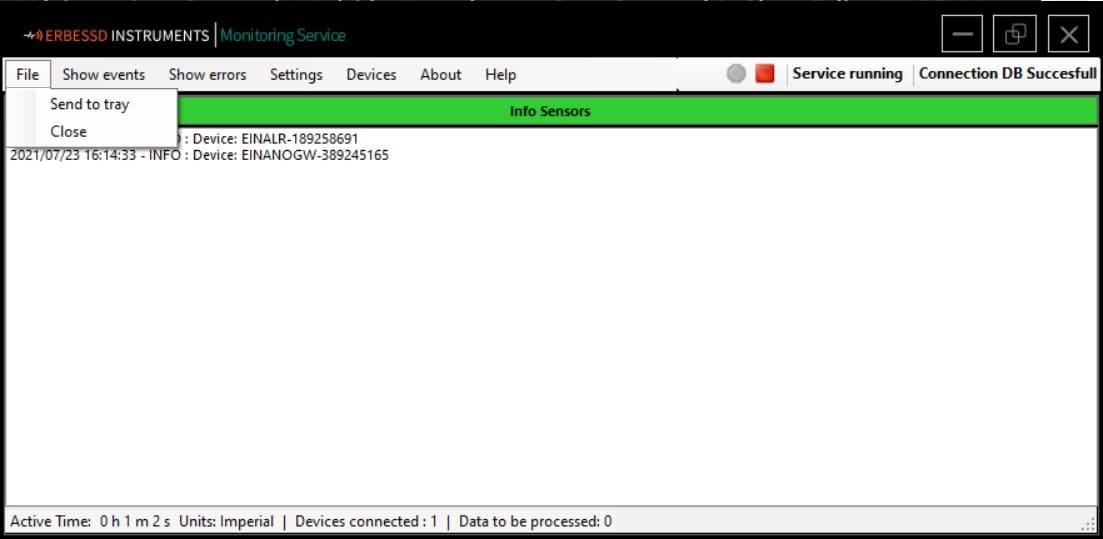
- Send to tray: This tool allows you to minimize the software in the “Hidden Icons” tray on your computer. To display the window again, just right-click on the icon in the “Hidden Icons” tray and click “Open”. The minimized EI Monitoring Service software will immediately appear in the taskbar.
- Close: This tool closes the software completely without receiving any data.
Show Events Menu:
This menu shows useful information about the sensors connected to the Gateway. For Accelerometers and GPIO sensors the information is divided into Data (Vibration sensors), Status and Settings. For Current, Temperature and RPM sensors the information that can be displayed are Status and Settings.
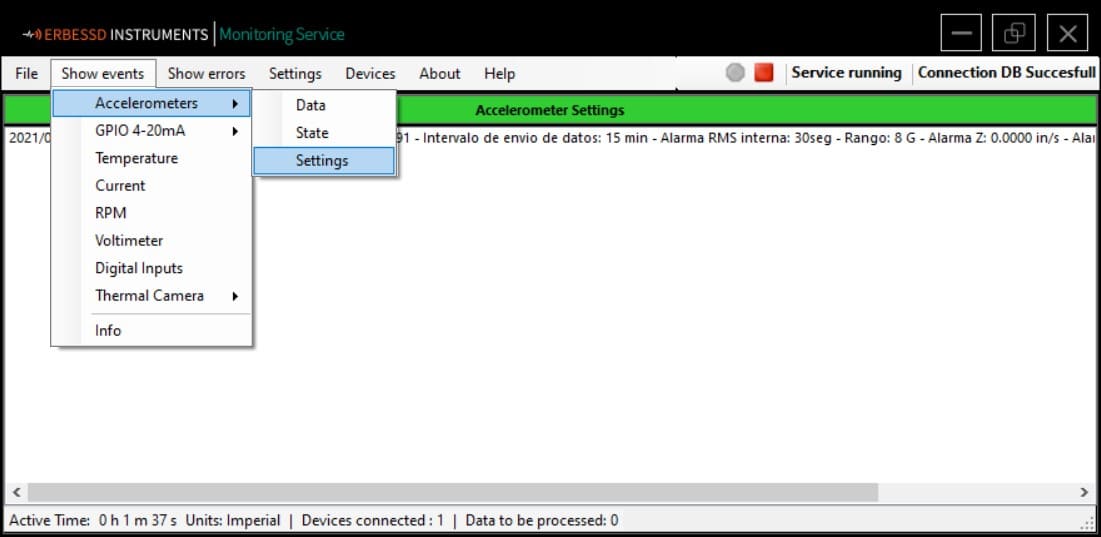
- Data: This option creates a log each time data is received for each sensor and is a tool that also serves to diagnose problems in these devices.
- State: With this option we can visualize the health status of the device. Through the data captured in each axis, the battery life status, the firmware version installed on the device, etc.
- Stettings: This option creates registers to communicate with the monitor and send the configurations that each sensor has. The configurations that we can observe are the time interval send data, range and alarm value.
Show errors / Hide errors Menu.
This option will split the EI Monitoring Service screen to display the Error window. This window will show connection and data collection problems.
Menu Settings.
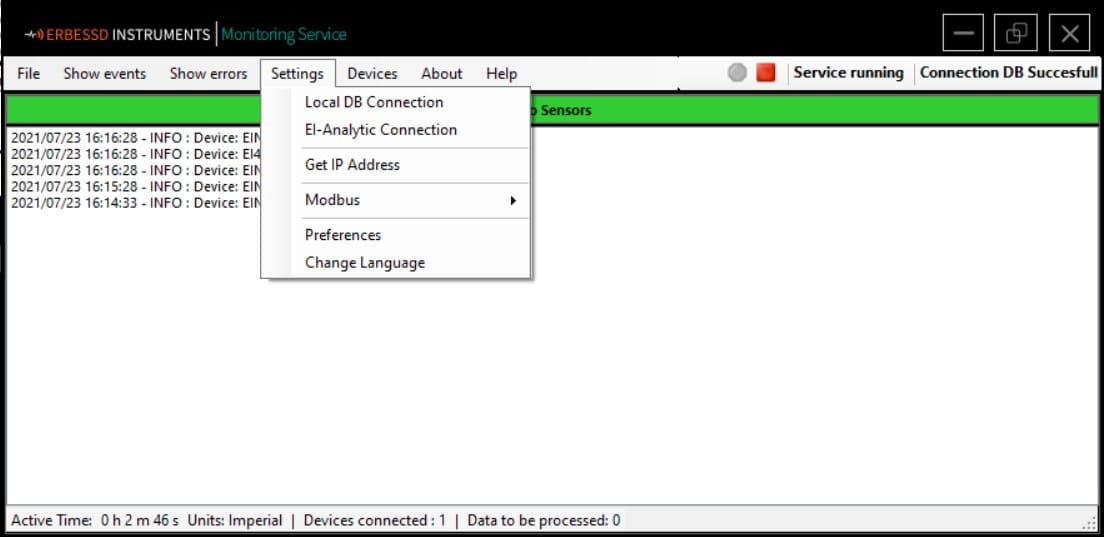
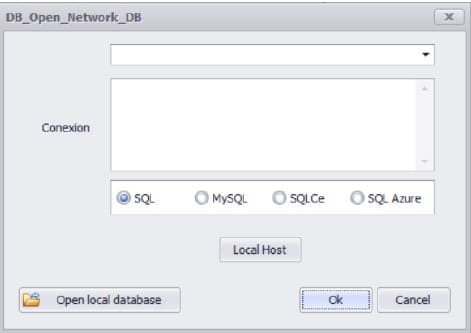
- Local DB Connection: Clicking this option will open the file explorer window. Choose this option it you want the data to be storaged in a local database.
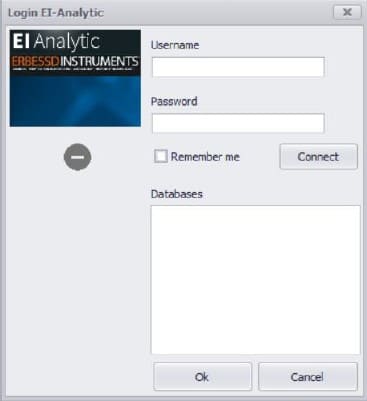
- EI-Analytic Connection: Choose this option if you want a cloud storage based option on the EI Analytic cloud service.
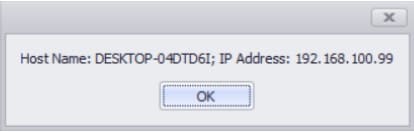
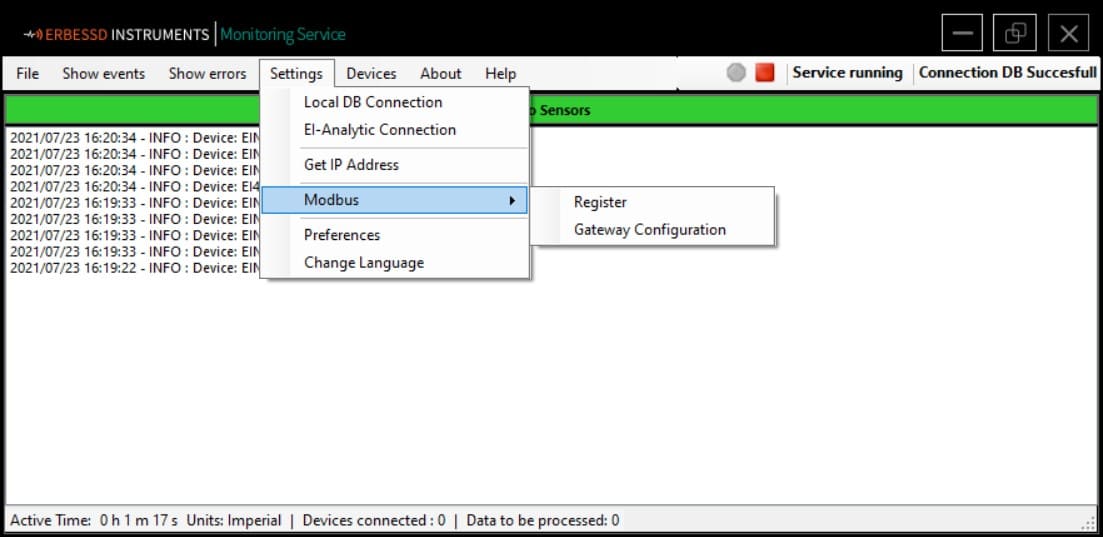
- Get IP Address:This option will show the name of the computer and the IP address where it’s connected.
- Preferences:
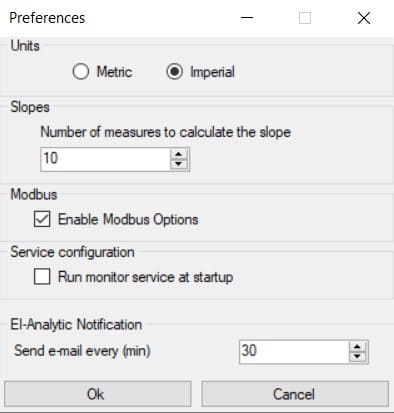
In this window you can change the unit system displayed in the software. The default unit system is Imperial.
Change the number of measurements to calculate the slope.
Enable the Modbus options for the software.
You can also create an email list that will notify the users on that list when an alarm activates. And the frecuency of the e-mails can be set from 1 minute to 100 minutes.
Choose to run the software once the computer turns on or open the software manually.
Once your configurations are set click ok.
- Modbus Configuration:Once the Modbus Options are enabled in the Preferences window you will now have access to the Modbus Configuration on the Settings Menu.
- About:In the about window you will see the installed version of the EI Monitoring Software.