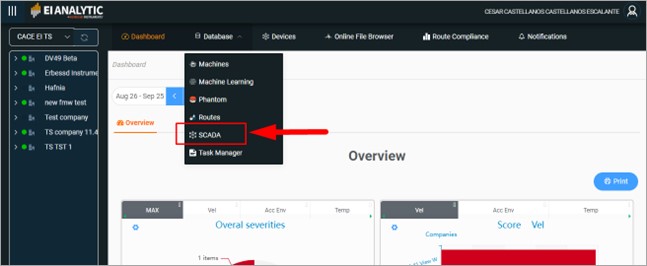
In the following manual, you will learn how to use the newest tool in EI-Analtyic™, SCADA schemes. First, log in from your EI-Analtyic™ account, then go to the Database tab and click on SCADA:
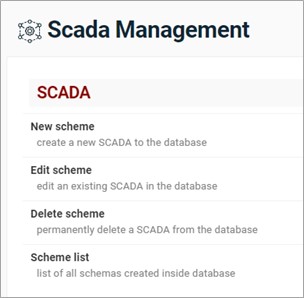
Now, you will see the following menu with these options:
1- New Scheme: Allows you to create a SCADA schematic with the image and data of your choice.
2- Edit Scheme: Allows you to edit a previously created model.
3- Delete Scheme: Removes an schematic from your database.
4- Scheme list: Displays a list of the schemas saved in your database.
1- New Scheme
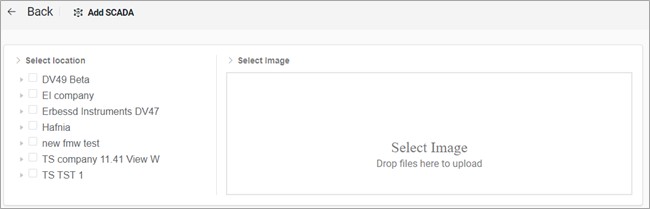
Click on New Scheme to create a new SCADA:
When starting a new schema, we will see on the left the databasetree, and on the right the select image section:
1.1. Initial Set up
1.1.1 Machines and Points
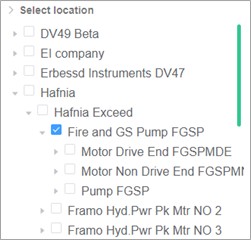
On the left, in Select location, expand the database tree with the arrows until you find the section that you want to visualize on the SCADA.
You can choose a point, a machine, or an area with several machines to visualize.
Click on the checkbox to choose the section.
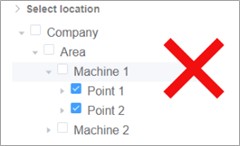
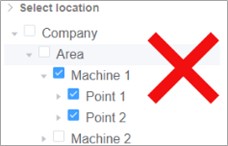
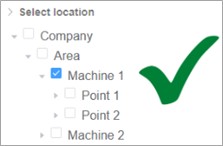
IMPORTANT:
It is not possible to mark several sections, to achieve this you must mark the top section containing those points/machines, see below:
Example, adding point 1 and point 2 to the scheme
1.1.2 Scheme Image
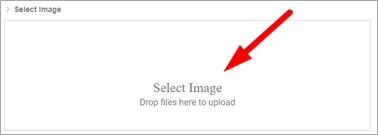
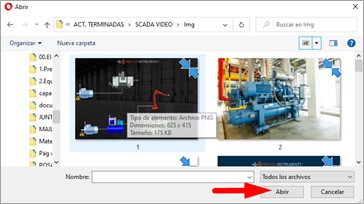
To the right, on select image, click on the box to load an image from your computer.
This will open the Windows file explorer, use it to find the image you want to load and click open.
After that, click on next to continue.
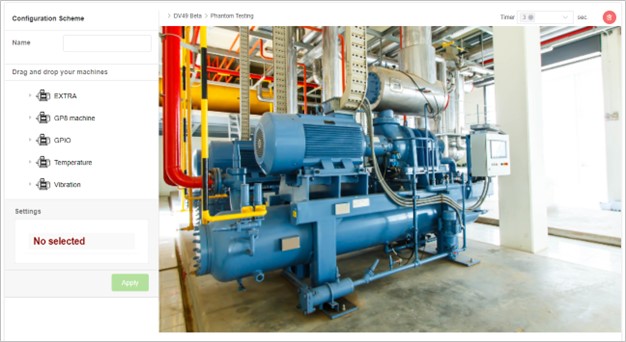
1.2 Scheme Settings
In the next window, you will see the image you loaded earlier along with several tools described below:
1.2.1 Scheme Name
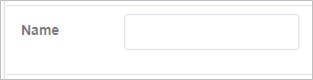
On the name section, enter a name for your scheme on the empty field that is shown on the picture to the left.
1.2.2 Generate ITEMS
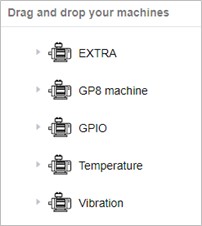
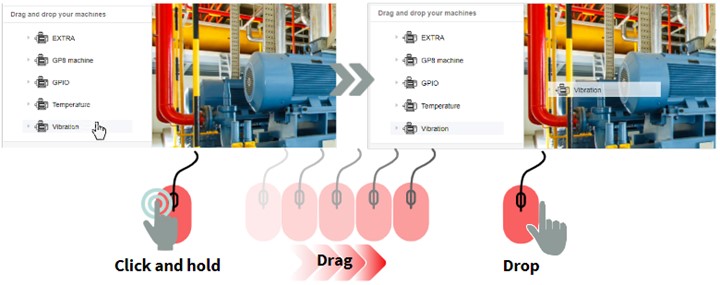
Below the name section, on the left side, you will have the machines or points that you chose in the section 1.1.1Machines or Points.
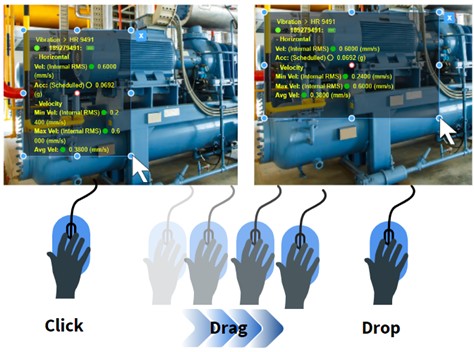
Choose the machine or point you want to add, and drag it to the schematic image as shown below:
Once you release the section, the wizard will be displayed, as shown below:
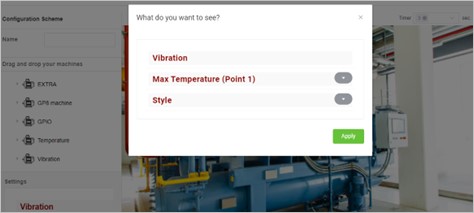
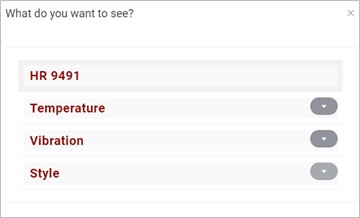
1.2.3 Configure Item
In the wizard you will be able to choose which data you want to monitor; the available parameters will depend on the section you have chosen. To monitor vibration data, it is necessary to choose an analysis point.
When you add the section, you will see the parameters that you can monitor from that point or machine.
Expand the parameters with the button to the right.
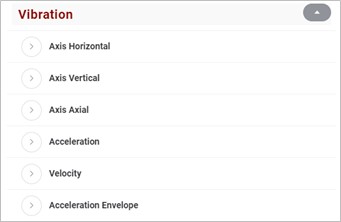
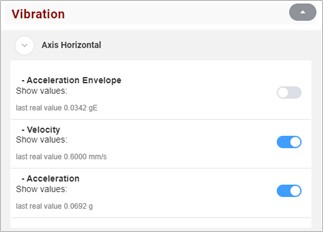
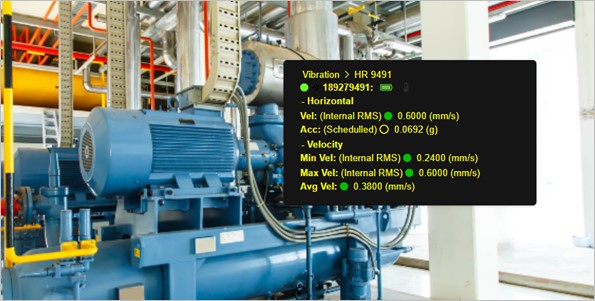
For this example, we expand the vibration parameter. First you can choose between each measured axis, and then you will have the option to add acceleration, velocity, and acceleration envelope.
Click on the arrow to the left to expand one option.
For the horizontal, vertical and axial axes, you can display the acceleration envelope (gE), velocity (mm/s) and acceleration (g) measured in each of them.
Use the slider button and activate it to select the measurement.
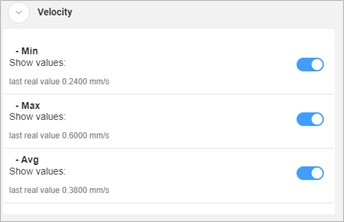
For the acceleration, velocity and acceleration envelope, you can see the minimum (Min), maximum (Max) and average (Avg) value of each parameter.
Use the slider button and activate it to select the measurement .
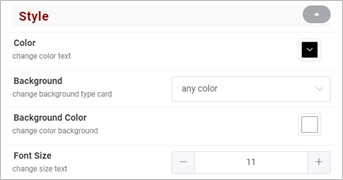
When you have finished choosing the parameters, you can customize your item in the style section, click on the grey arrow to expand the options.
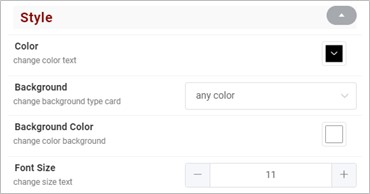
1.2.4 Customizing the Item
In color, choose the item text color.
In background¸ select whether the background will be transparent or colored, use the checkbox to pick.
If you selected “any color” in the previous option, you can select the background color.
In Font size you can change the font size by using – and + to adjust it.
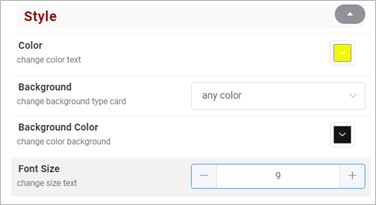
Let’s look at the following example, of an item generated with the following configurations:
1.2.5 Modify Item
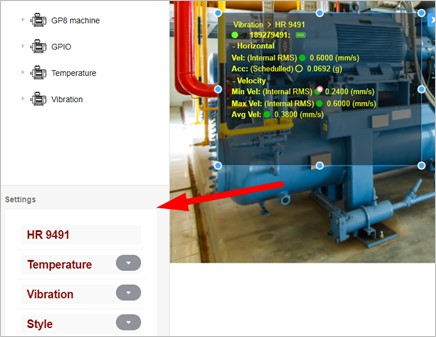
When you add an item, you will be able to reconfigure it from the settings section, which is located at the bottom left of the screen.
There, you will have all the tools we saw in the previous sections, both data and style.
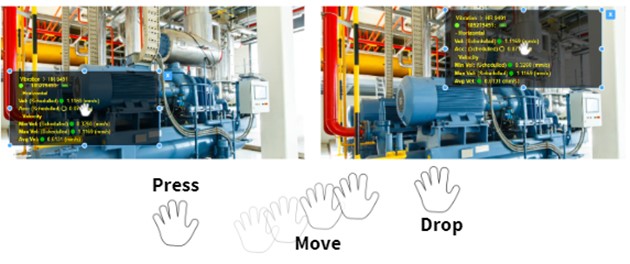
You can also change the item size with the buttons that are generated on the perimeter of the rectangle. Click on the button and drag it to modify the shape of the item.
You can also move the item to the place on the screen where it suits you best, click and hold on the button and drag the frame to where you like, or click anywhere on the surface of the frame to move it.
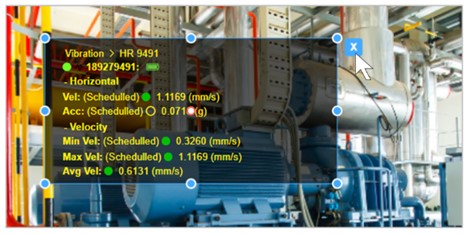
You can delete the item from the schematic with the button X located in the upper right corner of the box.
1.2.6 Final Configurations
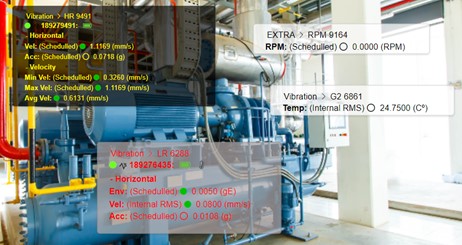
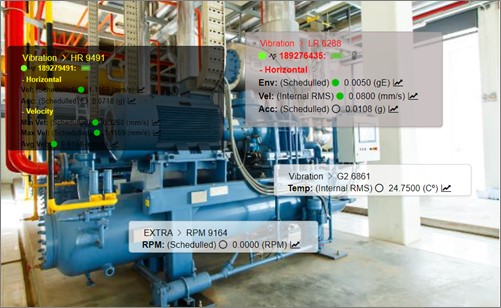
You can add as many items as you require, following the same procedure described above.
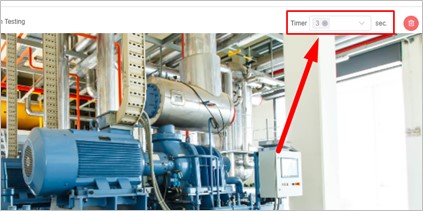
You can also change the query time of the whole schema, at the top right you will find the Timer section, expressed in seconds, marks how often the data will be updated in your schema.
To change the time, you must first delete the current option with the button X, then scroll down the list, and choose an option.
Finally, you can delete all items from the schematic with the red button in the upper right corner
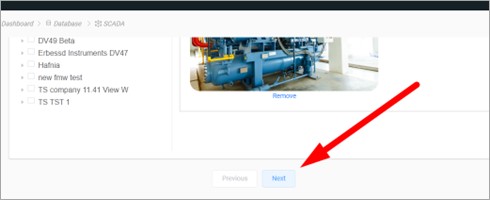
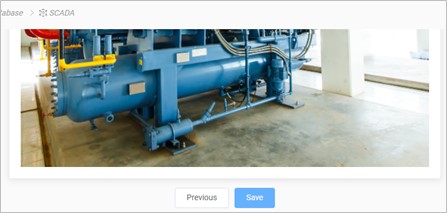
Once you have finished configuring your schematic, click NEXT at the bottom of the page:
Finally, click SAVE to save the schematic:
2 – Edit Scheme
Click on edit scheme to edit a previously created scheme.
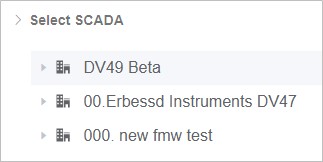
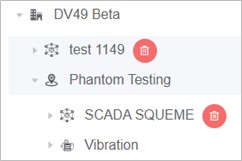
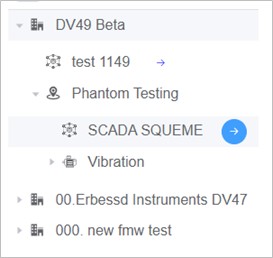
When you click on edit, you will see the database tree, and the areas where you have created a schema.
Expand the database tree to find a schema, and click on the blue arrow located to the right to choose one.
When you select the schematic, it will open with all the tools described in section 1.
Click on UPDATE when you have finished editing to save your changes.
3- Delete Scheme
To delete a schema stored in the database, you must click on Delete Scheme.
Similar to the edit tool, when you click on delete you will see your database tree, with the areas where you have created a schema.
Expand the database tree to find the schema, and click on the red button to delete it. The tree will be updated automatically, and the schema will be deleted from the database.
4- Open Scheme / Scheme List
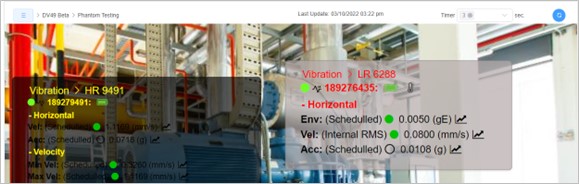
Click on Scheme List to open a SCADA scheme and star monitoring.
Clicking on scheme list will open the display window, on the left side you will have the database tree.
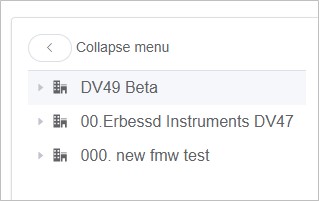
At the top, the button “colapse menu” will allow you to hide the database menu, to see your schema in full screen. Once collapsed, you must click on the blue botton to show the menu again.
Example of the collapsed menu:
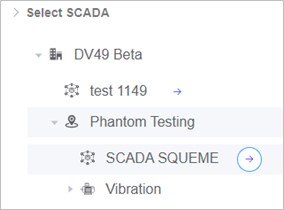
To view a SCADA schema, expand the database tree to find the schema, and click on the blue arrow to the right to open it.
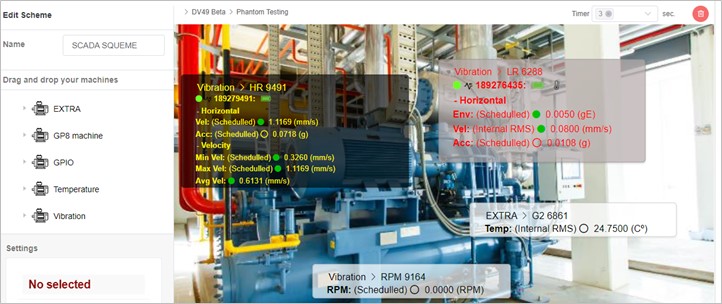
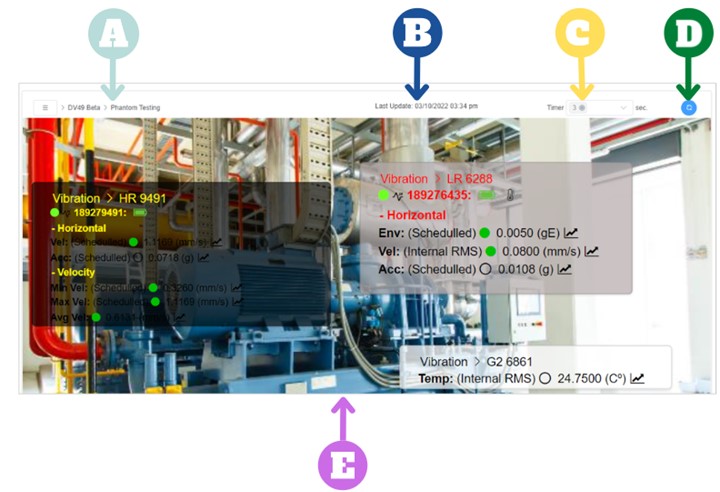
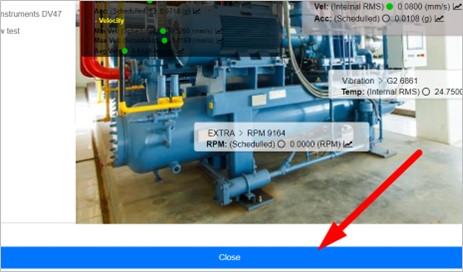
Once you open the schematic, you will see the following:
• On section A, you will see the area or machine where you schematic is located.
• On B, date and time of the last time the data was updated in the schema is shown.
• On the timer section, on C, you will see the seconds it takes to update the data on the items, according to what you have previously configured.
• With the blue button on section D, you can manually update the data of the items.
• Finally, section E, is the schematic main screen, you will see all the items configured and the values of the parameters you chose before: