
Vibration Analysis in a Hyundai Sonata Internal Combustion Engine With Dragon Vision
Combustion processes and impurities in the fuel affect the useful life of the internal combustion engine, thus it suffers a series of degradations, due to its frequency of use, long operation periods, deterioration of its moving parts and lack of maintenance; consequently, if corrective actions are not carried out once these deteriorations occur, the engine will not be able to operate normally, leading to a decrease in its performance and a shorter useful life.
For this, it is proposed to apply predictive maintenance using vibration analysis through an innovative program called DragonVision®, which bases its analysis from a cell phone video recording; avoiding the assembly of equipment and trained personnel that are commonly required for vibration analysis, making this project a feasible and reliable proposal as the main diagnosis in vibration analysis.
This software uses a reference pattern, which consists in longitudinally measuring any element of the engine in favor of the view of the recorded video, that is, the measurement of the element in the “X” or “Y” axis depending on the geometry of the same, such measurement intervenes in the video processing, since it assimilates the depth and dimensions of the internal combustion engine.
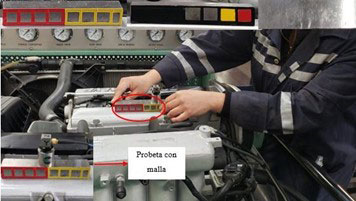
1 – Location of Test Tube for Video Recording
In the experiment a test tube was placed with a mesh, the same that consists of three views: a view with a yellow and red sectioned part, another view with a complete black part, two gray colored flat squares, and two of color, yellow and red respectively; and a last solid view of whole gray color, since when performing the analysis in the software the test tube facilitates the location of the points that correspond to the ends of this mesh when considering them as reference points, and can run the analysis in a more effective way.
2 – Environment Adapting Sequence for Video Acquisition
Here the environment conditioning sequence for video acquisition is shown, starting with the Phopik lighting equipment implementation in order to provide greater luminosity to the study element, which offers 3 colors of lights: warm, white and cold; with the help of the lux-meter it was determined and verified that the white light color offers greater amount of lumens with respect to the other colors, at the same time, the location of the tripod was performed verifying the flatness of the contact surface, in order to attenuate the vibrations foreign to the study element and finally, the fixation of the cell phone configured with the resolution and frames supporting the experiment.

3 – Procedure for Data Processing in the DragonVision® Program
I. First, a video shot of the object under study, in this case the internal combustion engine with a spark ignition, is captured, and the video is transferred from the cell phone to the laptop computer.

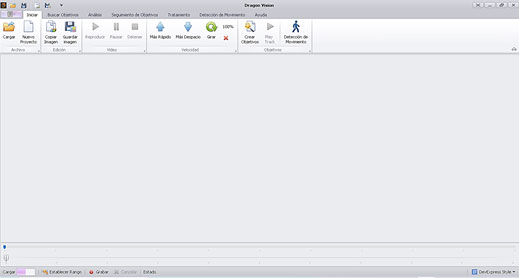
II . Then start the software and the main window is displayed in which the videos for analysis or projects that have already been completed can be loaded.
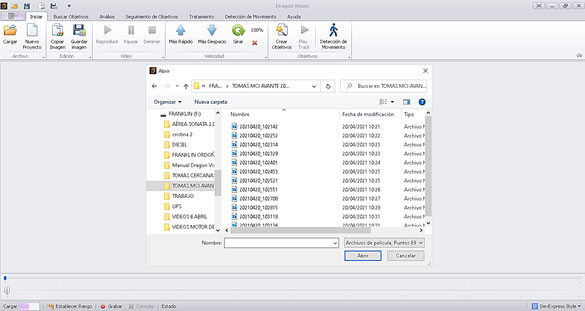
III. Upload into the software the videos for analysis through the “Upload” folder, then click on the open button allowing the video to be completely loaded into the software.
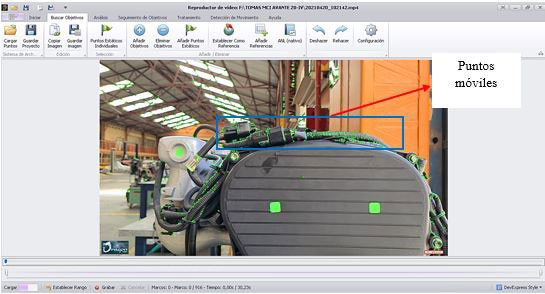
IV. Once the video is completely loaded con the software, go to the targets section.
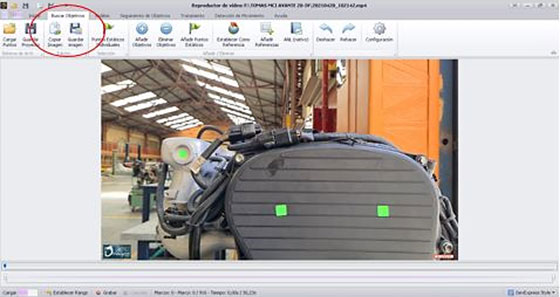
V. After selecting the area to be analyzed, click on the “Add Targets” button, which will generate analysis points that refer to the moving points, i.e. those that will be in motion when the internal combustion engine is running.
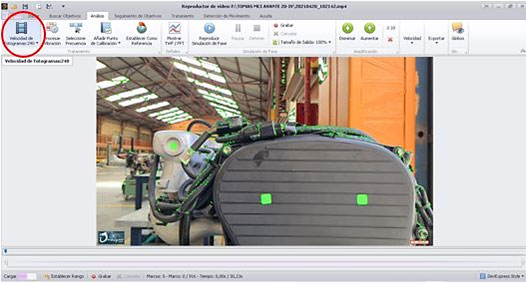
VI. Once the analysis points are set, it is necessary to select in the “Frame Rate” button the frames per second at which the engine video was captured.
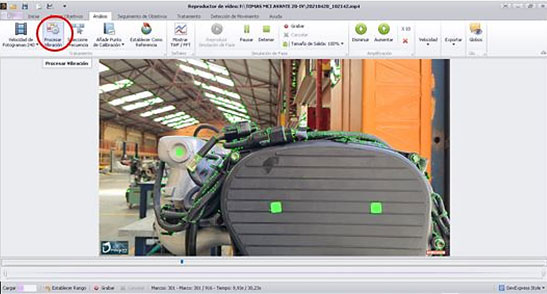
VII. After we select the FPS of the captured video, start the analysis process by clicking on the “Process Vibration” button and waiting while the software processes the information.
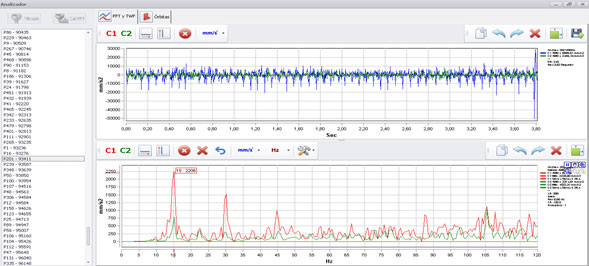
VIII. Once the processing is finished, you can view a graph of the spectra by clicking on the “Show TWF/FFT” section.
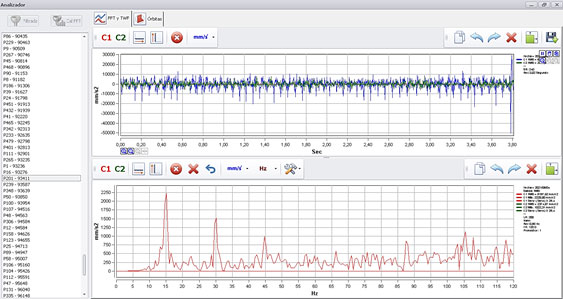
IX. Below are the graphs corresponding to a vibration signal of a selected point in the video. In the upper left part are the points selected in the video, each of them shows its own vibration signal. The signal shown in the upper part corresponds to the distance as a function of time and the lower graph shows the spectrum of the vibration signal, where the vertical axis represents distance and the horizontal ones, cycles per second (CPM) or Hertz (HZ).
4 –APPLIED TECHNOLOGIES RESULTS
|
MCI (Normal Condition) |
|||||
|
Element |
View | Position | Axis | Vibration signal frequency value [Hz] |
Video signal frecuency value [Hz] |
|
Camshaft |
Lateral | Horizontal | X | 8.5 | 9 |
|
Crankshaft |
Lateral | Horizontal | X | 17 | 19 |
| Combusting piston | Lateral | Horizontal | X | 34 |
38 |
|
MCI (FIRST INJECTOR FAILURE) |
|||||
|
Camshaft |
Upper | Vertical | Y | 7.16 | 7 |
|
Crankshaft |
Upper | Vertical | Y | 14.17 | 14 |
|
Combusting piston |
Upper | Vertical | Y | 28.33 |
29 |
| Cams | Upper | Vertical | Y | 56.67 |
57 |
|
MCI (COIL FAILURE) |
|||||
|
Camshaft |
Lateral | Horizontal | Z | 10 | 11 |
|
Crankshaft |
Lateral | Horizontal | Z | 21.67 | 23 |
| Combusting piston | Lateral | Horizontal | Z | 32.33 |
33 |
| Cams | Lateral | Horizontal | Z | 43.17 |
46 |
|
MCI (ISC VALVE DISCONNECTED) |
|||||
|
Camshaft |
Front | Axial | Z | 26.5 | 10 |
|
Crankshaft |
Frontal | Axial | Z | 53 |
21 |
| Combusting piston | Front | Axial | Z | 79.5 |
53 |
| Pistons not it combustion | Frontal | Axial | Z | 106 |
75 |
As can be seen in the table, there are important results according to the view and the operating condition in which the engine is found, in normal condition the best frequency values were in the side view in elements such as: camshaft, crankshaft and combustion pistons, with failure in the first injector the elements that contributed with more information were: camshaft, crankshaft, combustion pistons and cams in the top view, since the engine not having a cylinder working generates a vertical displacement, important values were also obtained with failure in the coils in the side view being: camshaft, crankshaft, combustion pistons and cams the elements that emitted the most information, due to the fact that the moment being working without all the coils raises its revolutions generating a horizontal displacement, and as for the failure caused by the disconnection of the ISC valve optimum results were obtained in the front view in elements such as: camshaft, crankshaft, combustion pistons and pistons that are not working.
Universidad Politécnica Salesiana de Ecuador and Erbessd Instruments have collaborated on a pioneering research project: a paper focused on vibration analysis through video. This innovative study was led by outstanding students of the university, who benefited from the enabling environment offered by the institution, recognized for its academic excellence and commitment to research. The article, the result of the synergy between the two entities, promises to bring new perspectives in the field of maintenance and vibration analysis.
The collaboration between Universidad Politécnica Salesiana and Erbessd Instruments highlights the importance of innovation and higher education in the generation of creative and cutting-edge solutions. This joint work reflects a shared commitment to the advancement of knowledge and technological development for the benefit of society. It also underscores the value of strategic alliances between academic institutions and leading companies in the sector, demonstrating how cooperation can drive research and generate positive impact in the scientific and technological field.