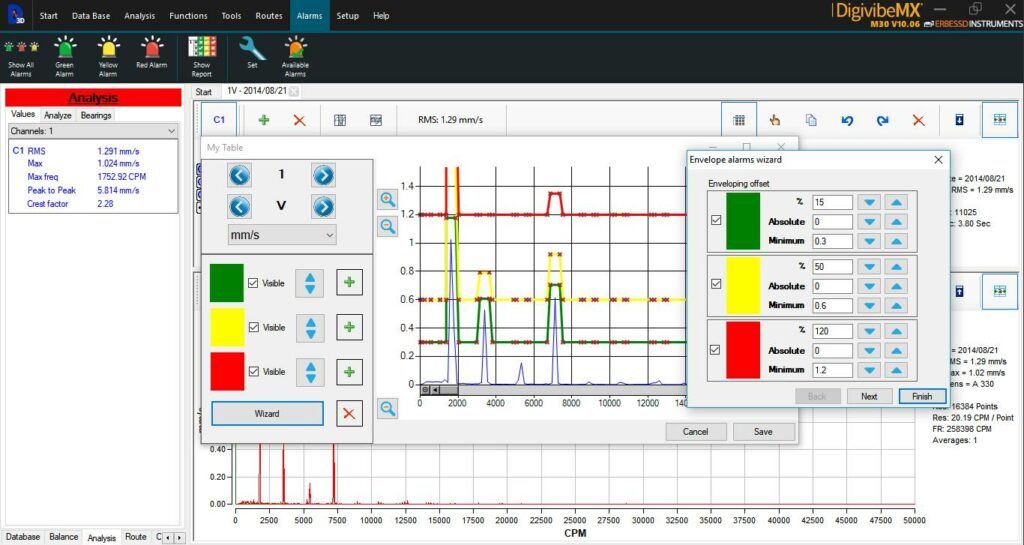
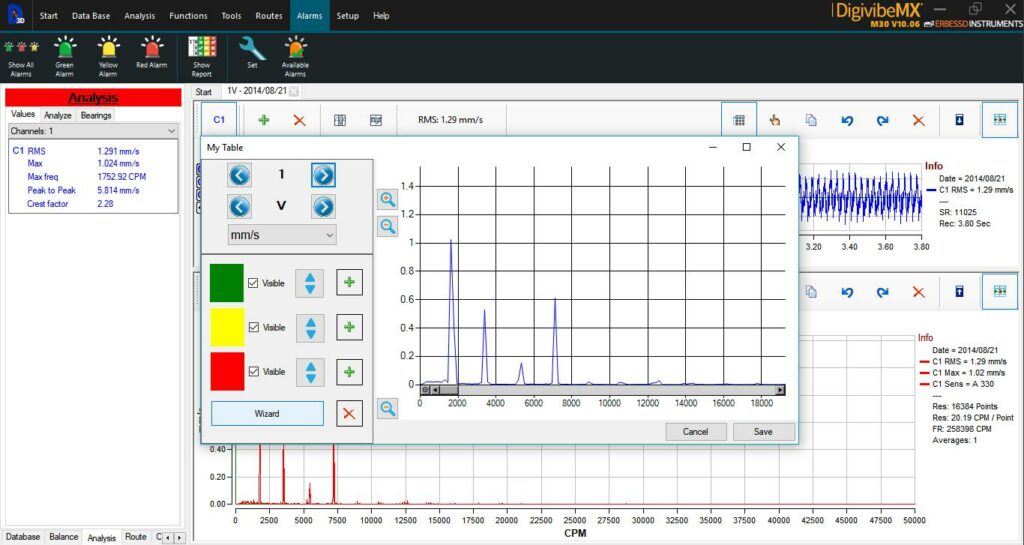
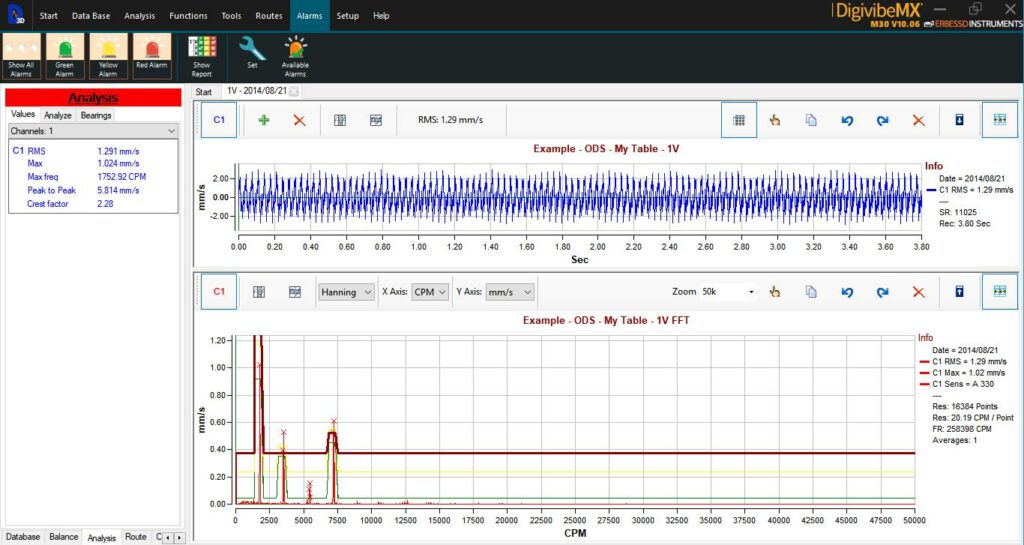
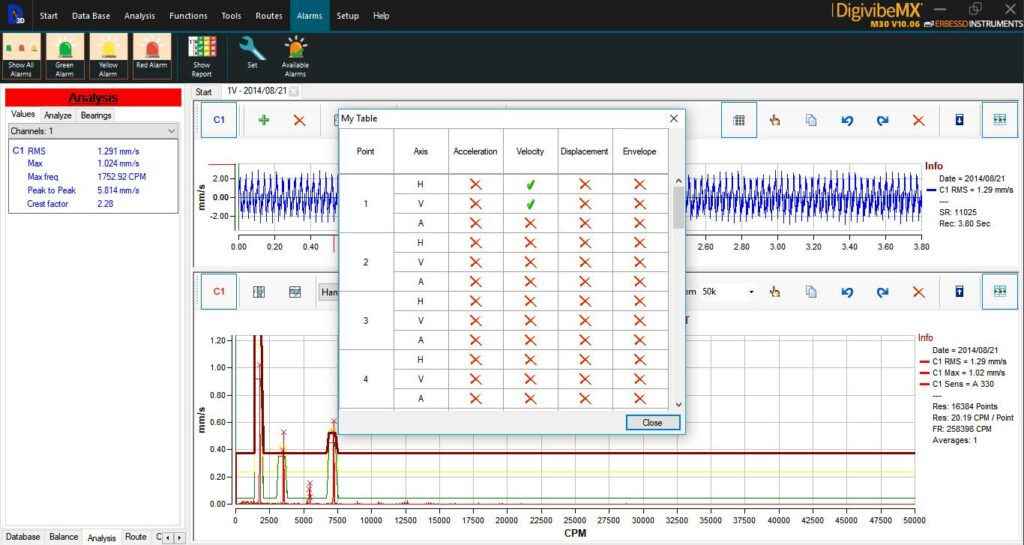
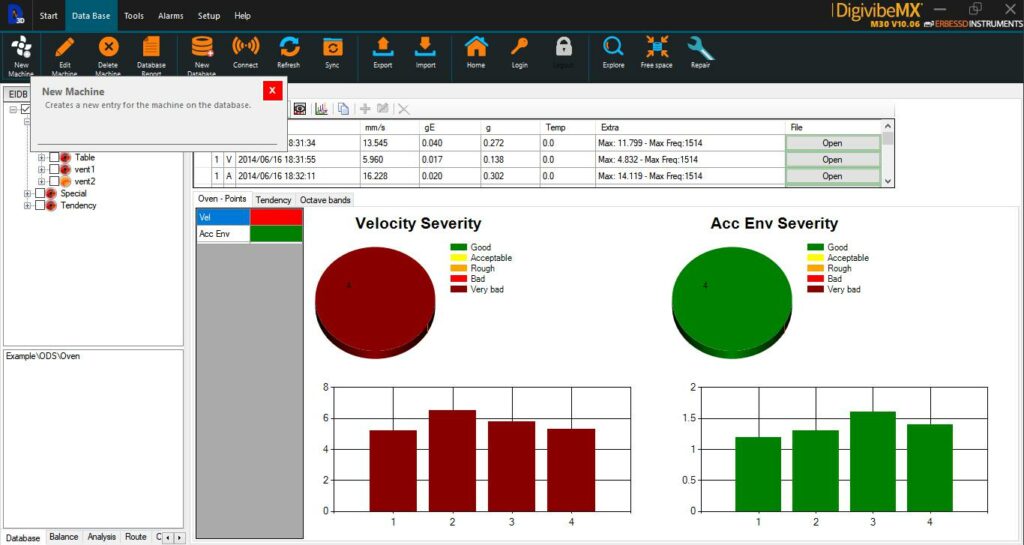
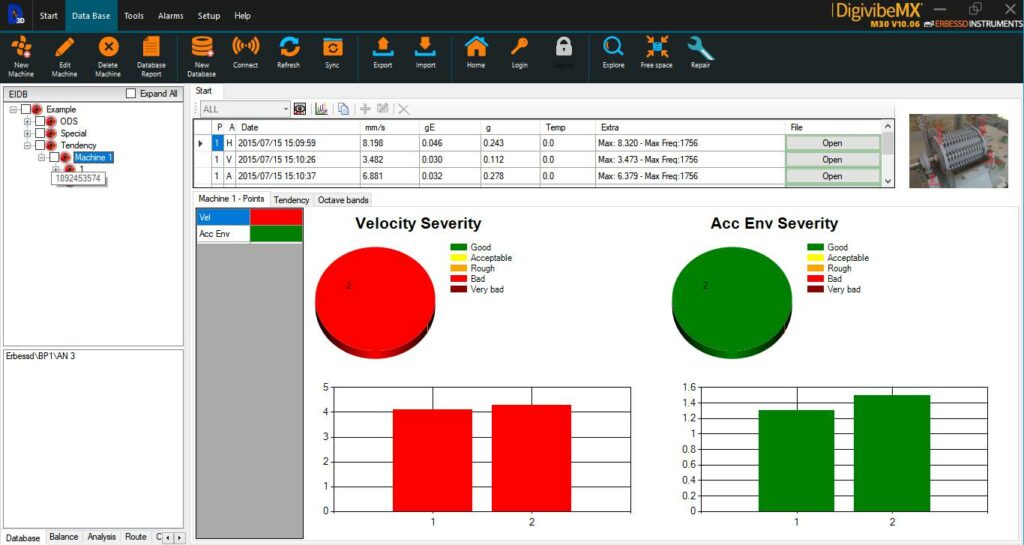
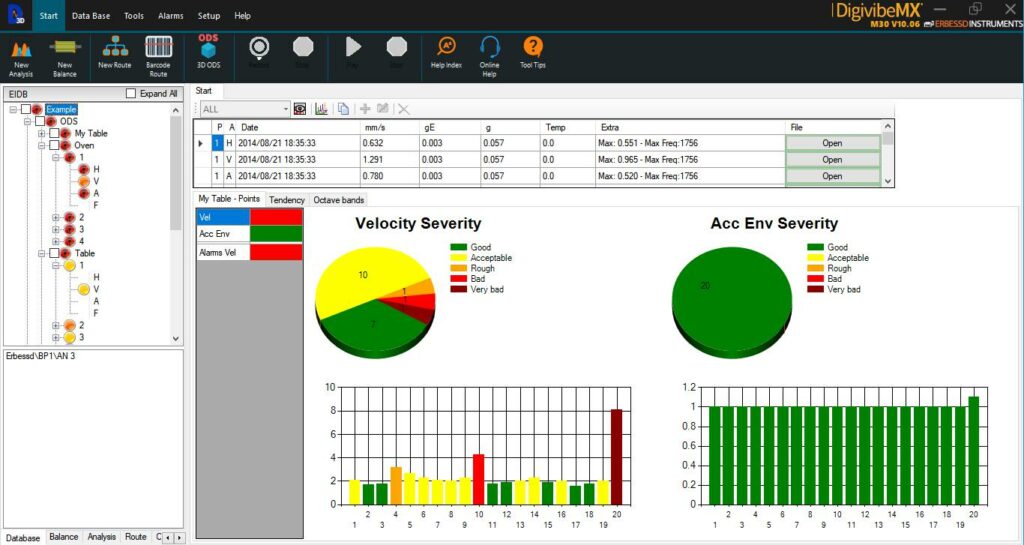
The envelope alarms give you the ability to visualize the machine health at first sight according to four categories (velocity, acceleration, displacement, envelope) for each axis (H, V, A) from each point of any machine.
Each alarm can be configured using a wizard dialog with default parameters and ranges or by setting custom values to meet your own requirements.
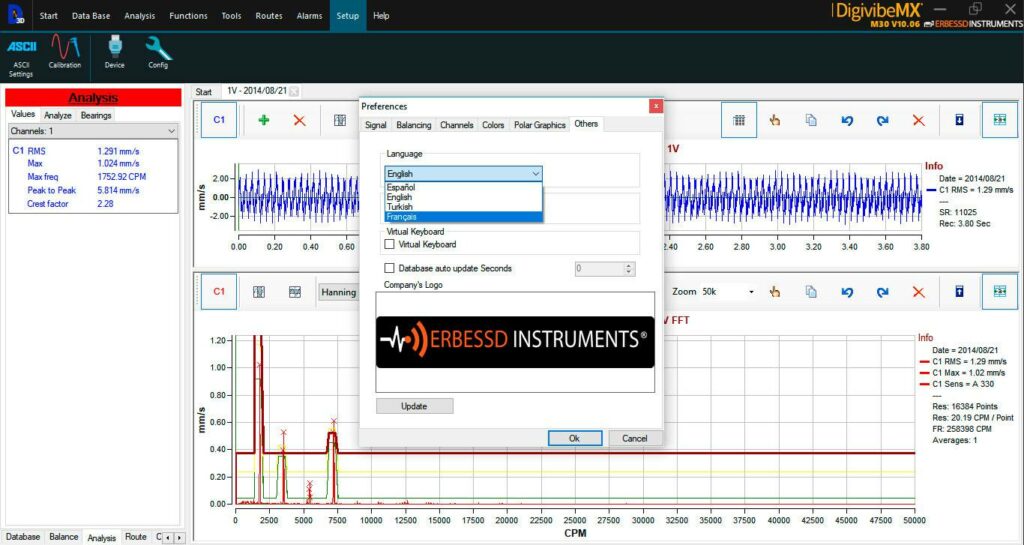
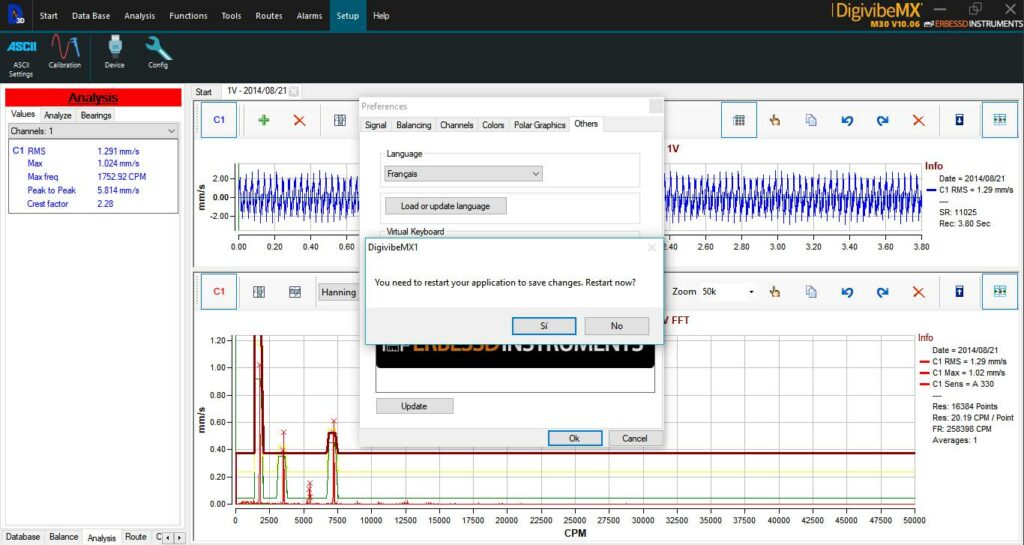
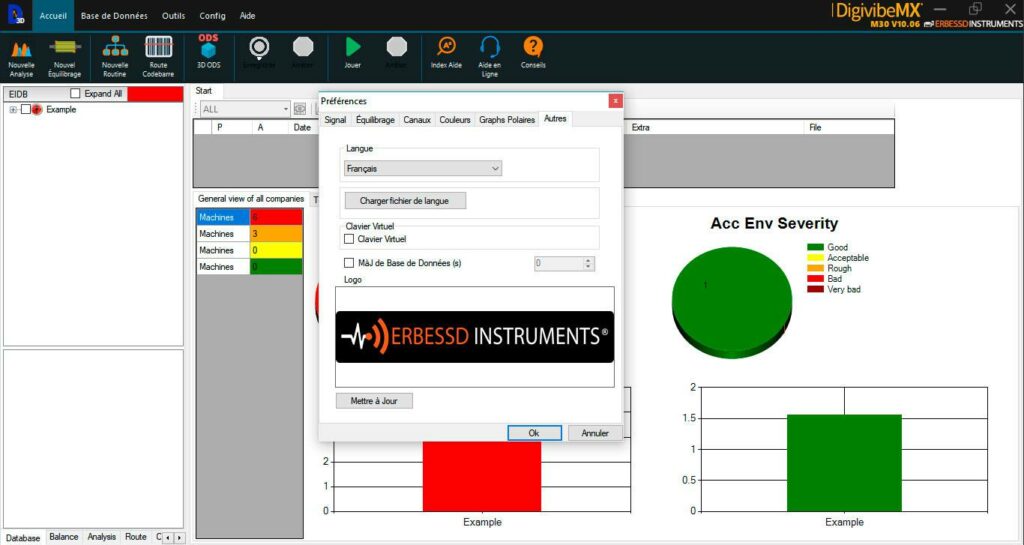
Multi-language Support
DigivibeMX® 10 supports more languages. Now it’s available in four languages: English, Spanish, Turkish, French and Chinese.
This new feature allows to download new language packages or update current ones.
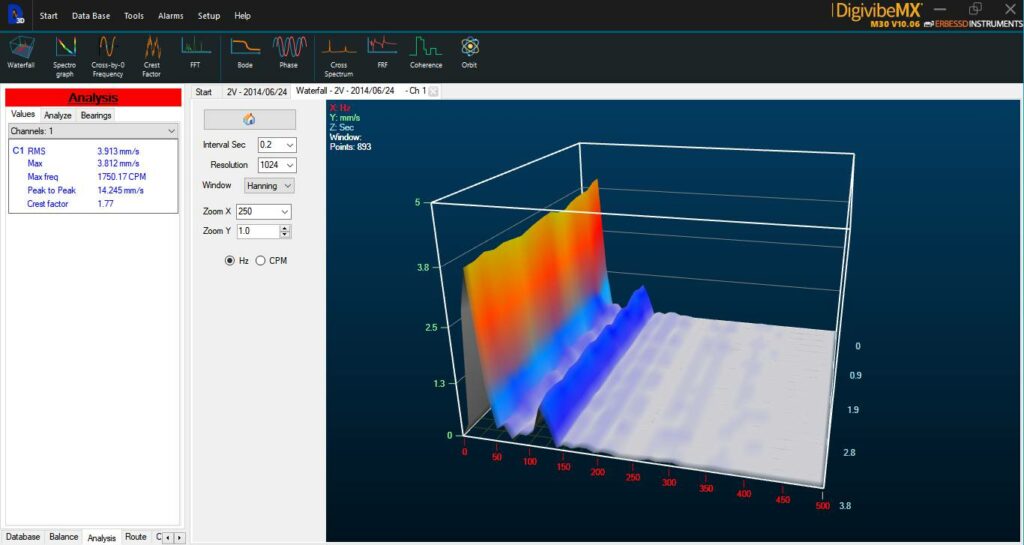
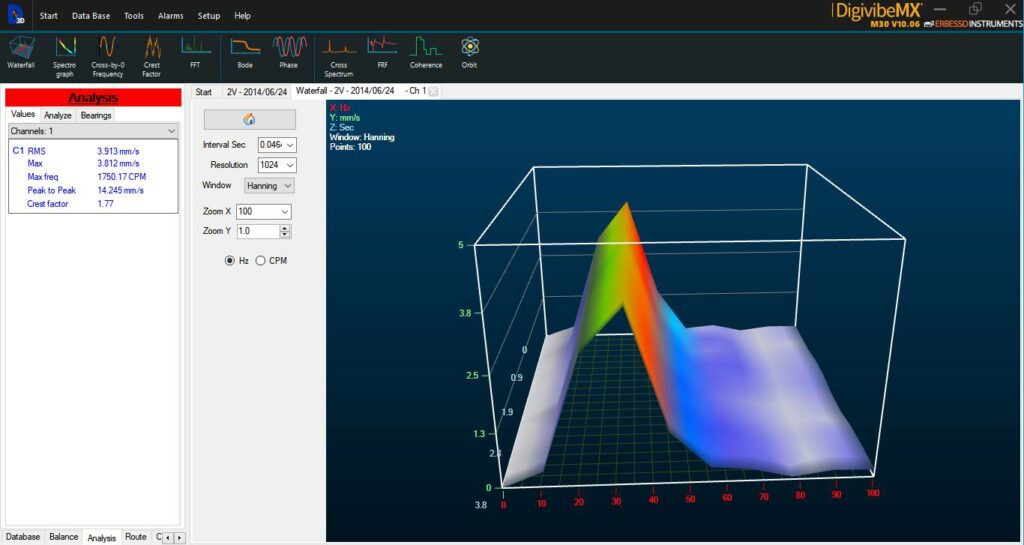
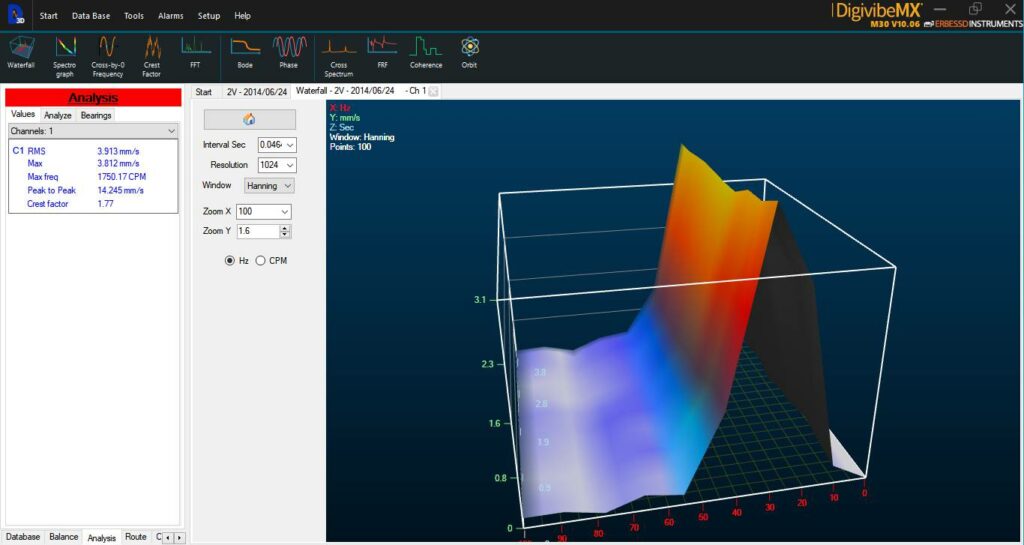
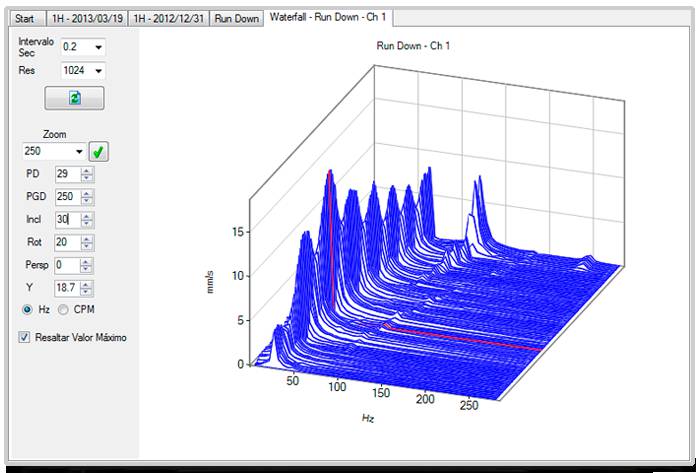
Real 3D Waterfall
A waterfall is a time-varying spectral representation (forming a 3D plot) that shows how the spectral density of a signal varies with time. In DigivibeMX M20 you can now enjoy the new real 3D waterfall tool which can be easily created and rotates when dragging the mouse over the graph like in common 3D software.
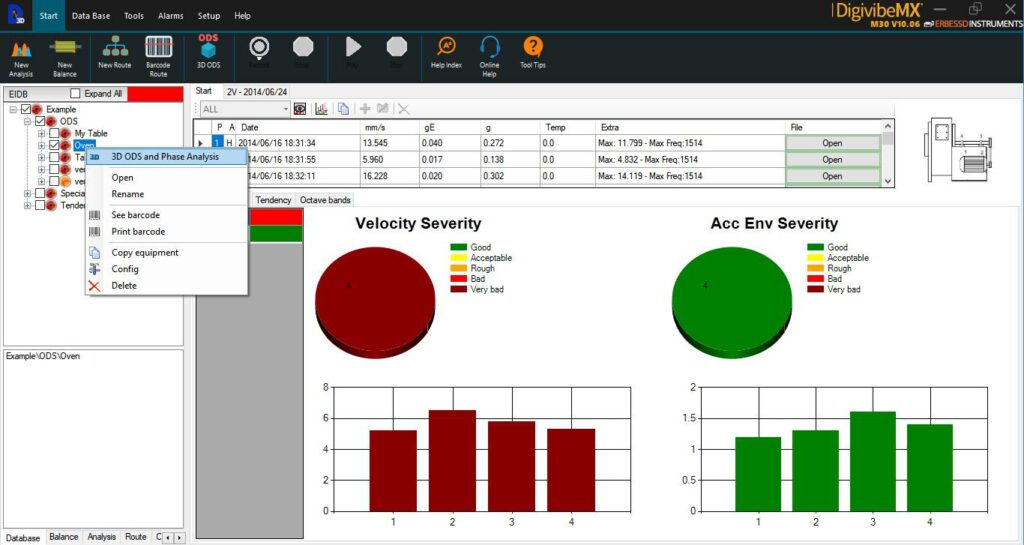
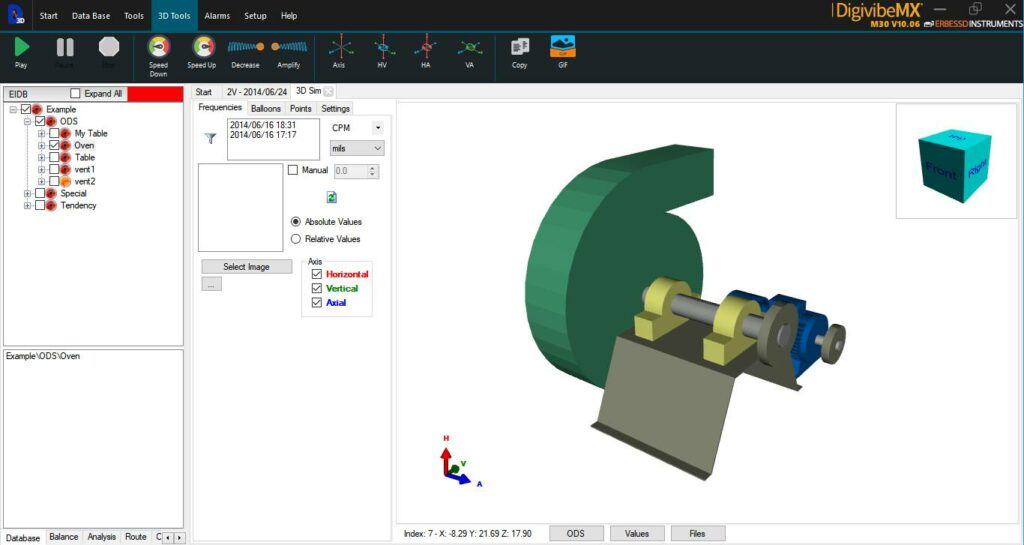
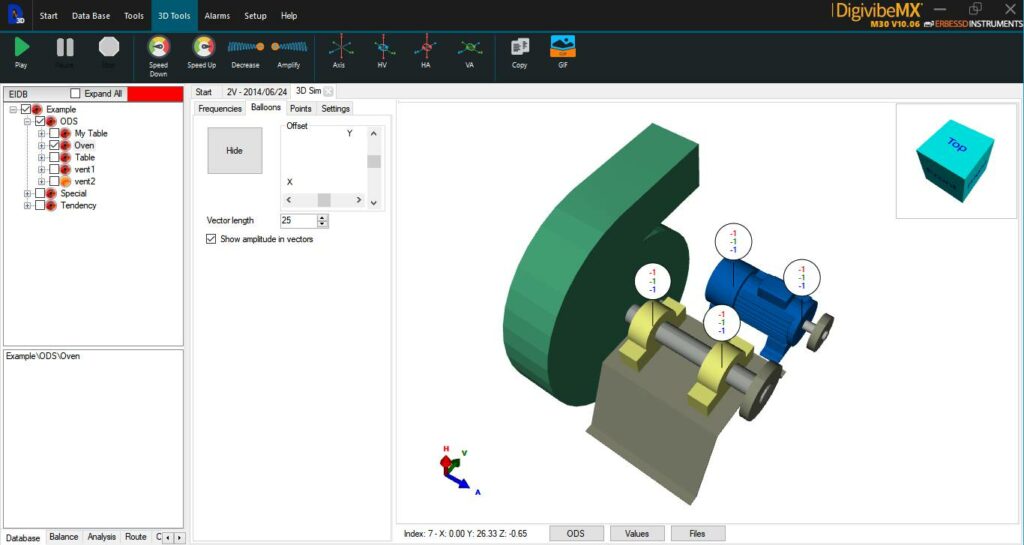
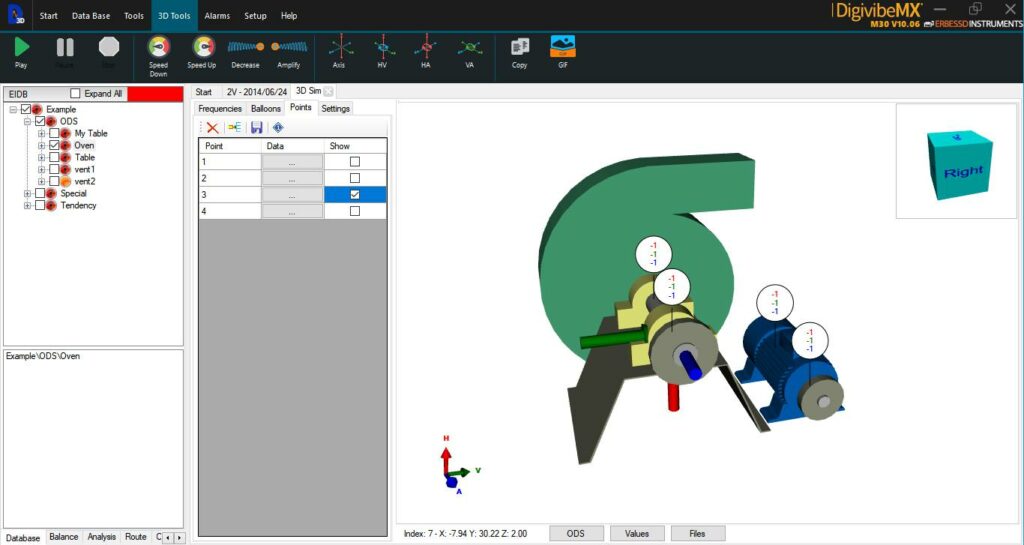
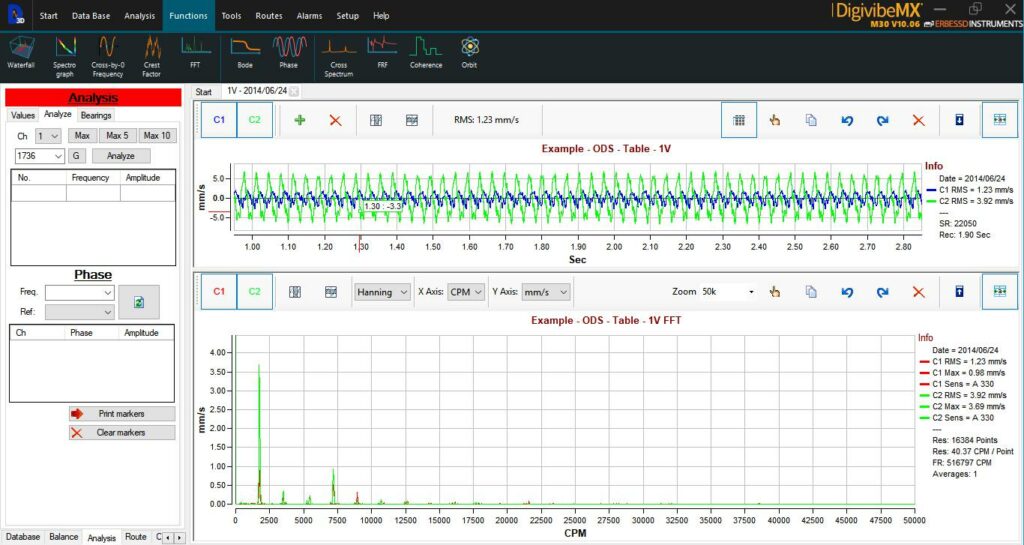
3D ODS Analysis
ODS analysis is now an easy task to do, no more complex drawing interfaces and complex calculations just create your 3D model in your favorite 3D software (3DS Max, Blender, Solid Works, etc.) and import it into the software in order to make a custom ODS analysis.
Once you have your drawing you only have to open a new route analysis and follow the points one by one to complete the analysis. The phase analysis for 3D simulations will also calculate coherence between signals as well as cross power and frequency response to be sure that all recording are coherent. All 3D simulations can be exported to AVI video format and animated GIF images compatible with any operating system.
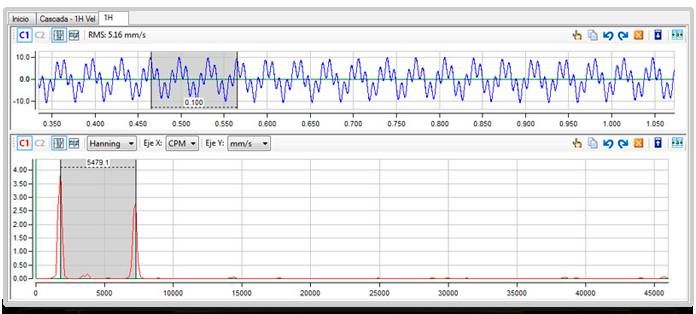
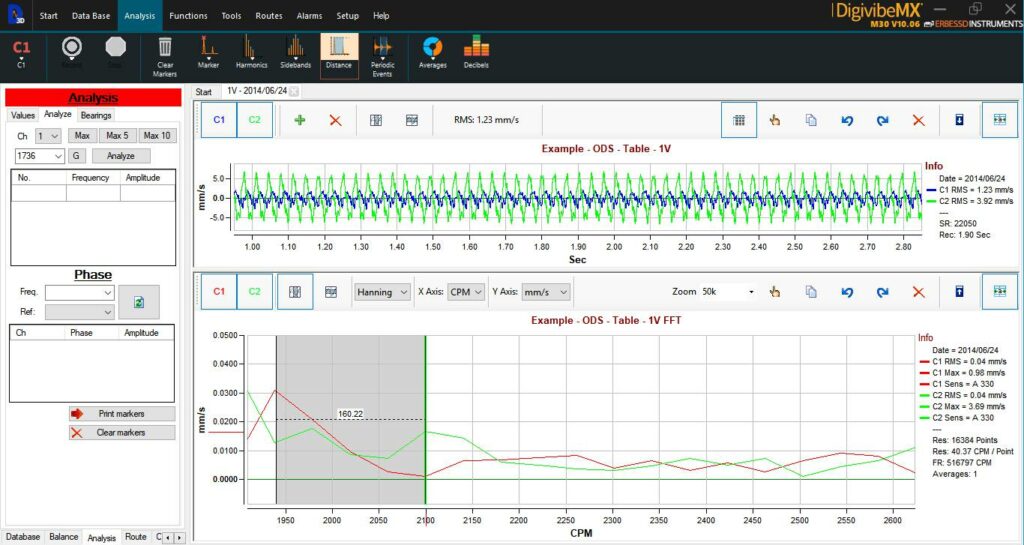
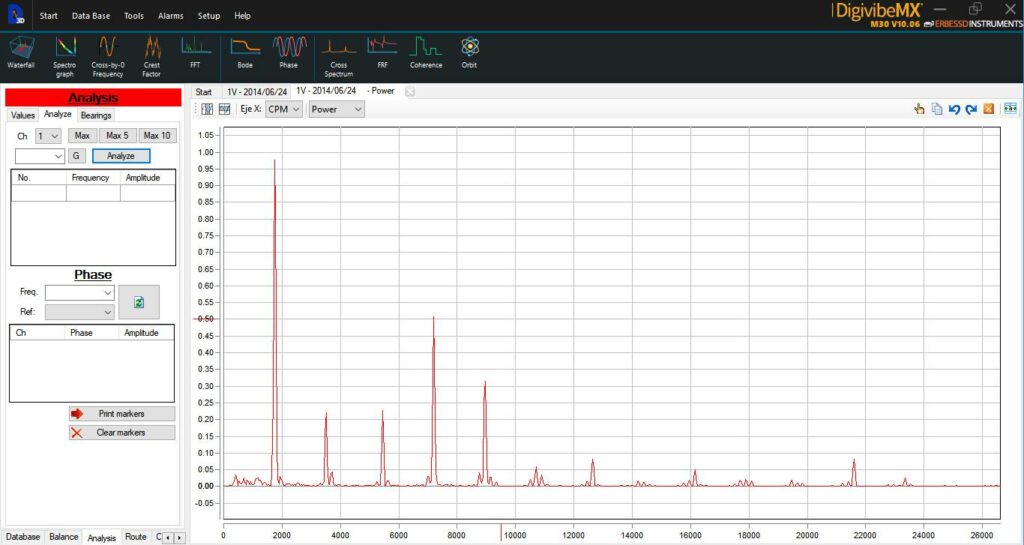
FFT Spectra
Most of spectral tools in DigivibeMXM20 are based on the FFT algorithm, with a frequency range capable of measuring low speed (1 Hz) up to speeds of 10 kHz. The accuracy of the spectrum varies according to the needs, reaching many millions of resolution lines. Its main purpose is to transform the signal from its time-domain representation to the frequency-domain representation, in order to identify different fenomena such as harmonics, electrical noise, etc.
Measuring Units
Avaliable Windows
• G
• mm/s
• µm
• mm/s²
• inch/s
• mils
Hanning
Rectangular
Blackman
Four, Six and Eleven Term Cos Sum
Hamming
Bartlett
Kaiser
Flaptop
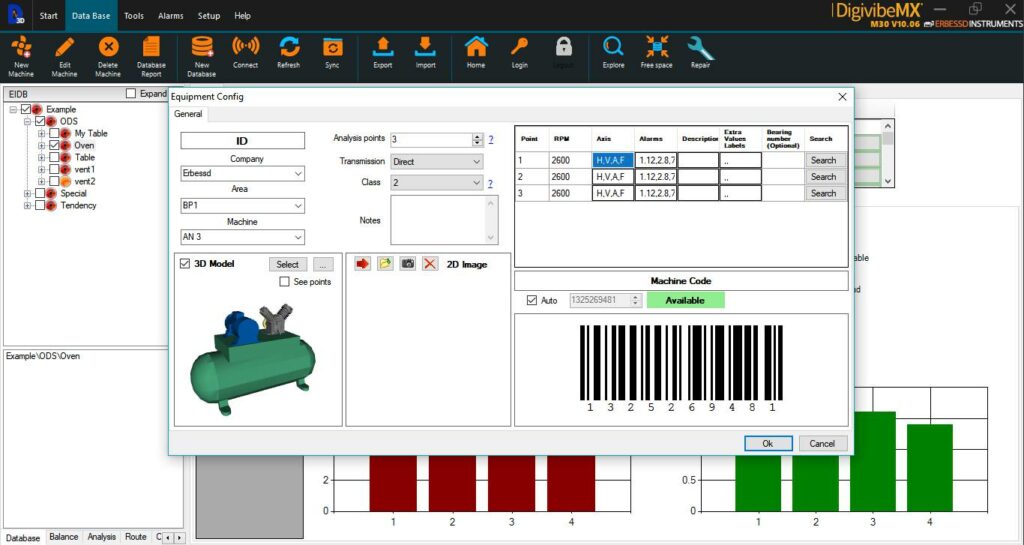
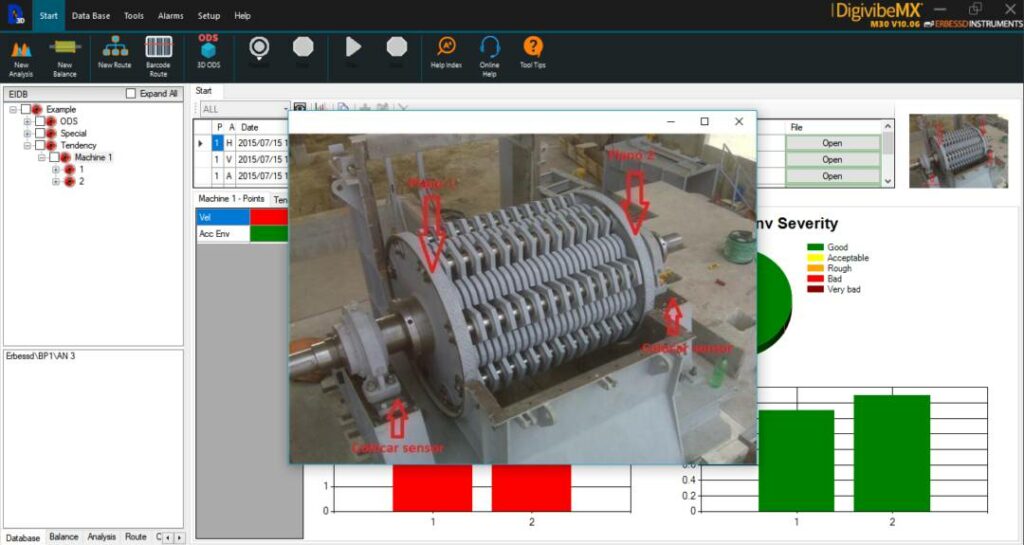
Machines Database
DigivibeMXM20 allows you to save all your machines features in order to make route analysis. Such information is:
General information
Specific information
Name, Area and Company
Measurement Points
Coupling joint
ISO Class
Picture or preloaded image
RPM
Name and dimensions of each bearing. (+20,000 bearings database with all their dimensions)
Bearing frequencies
Gear frequencies
Alarm frequencies
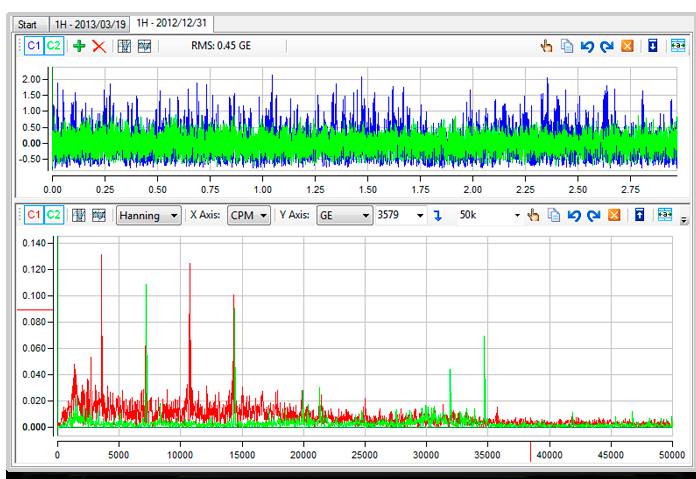
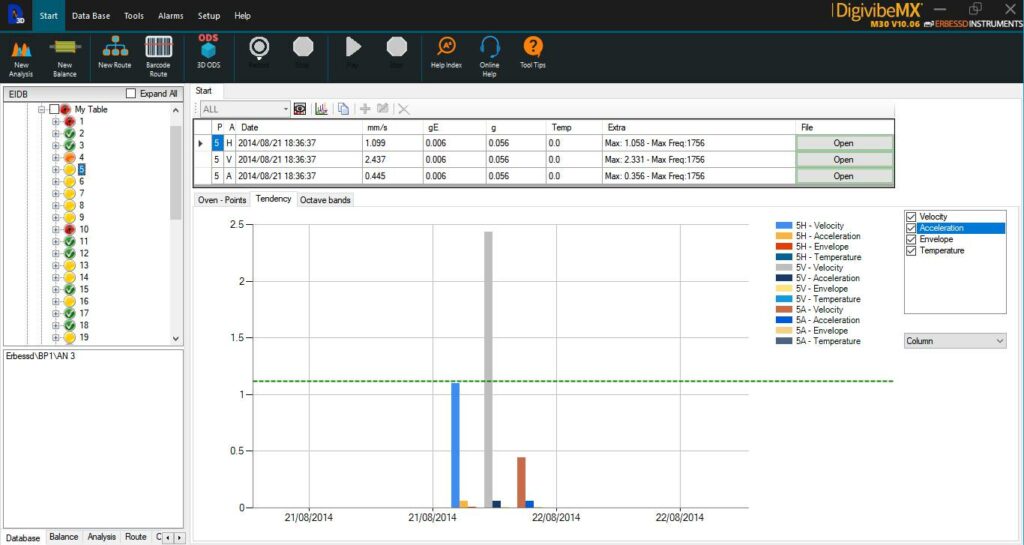
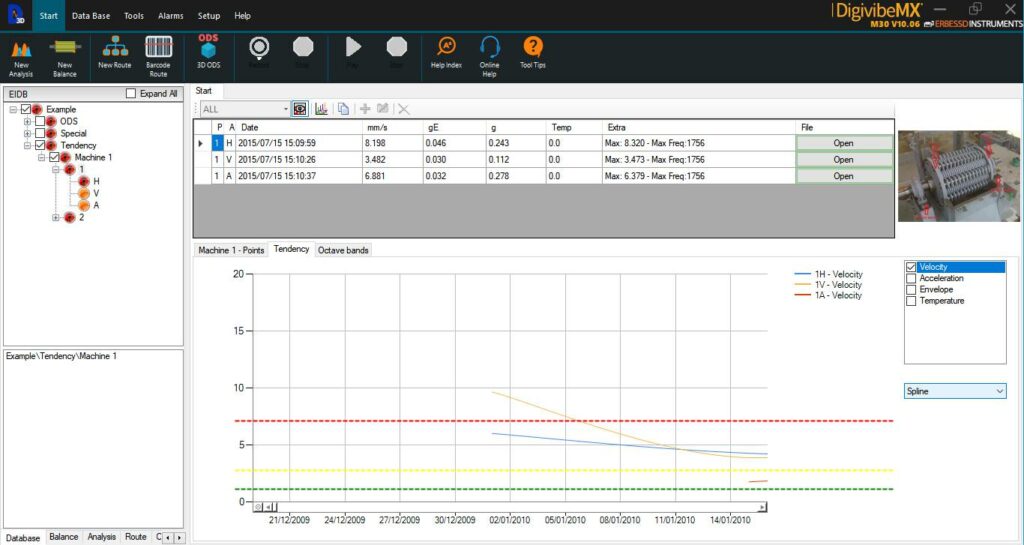
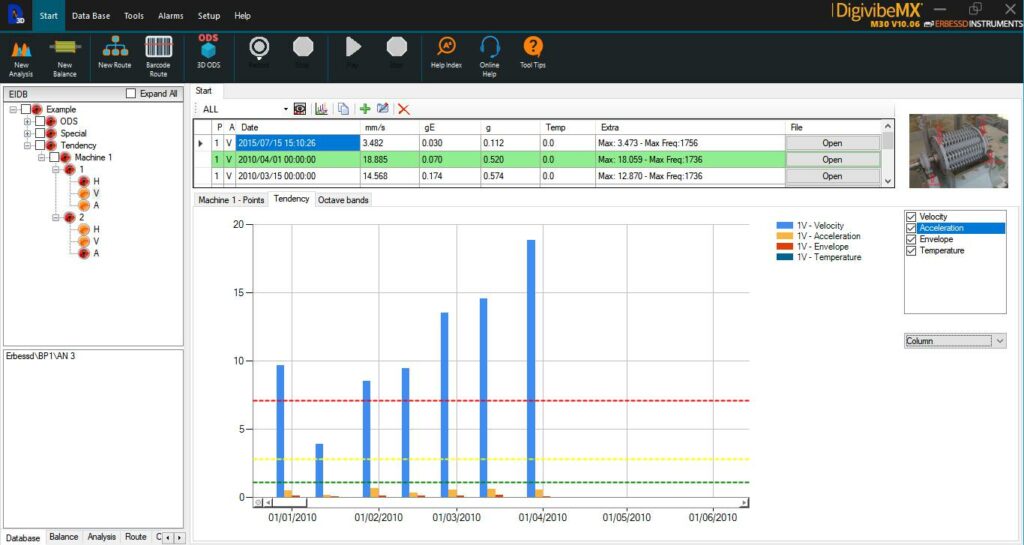
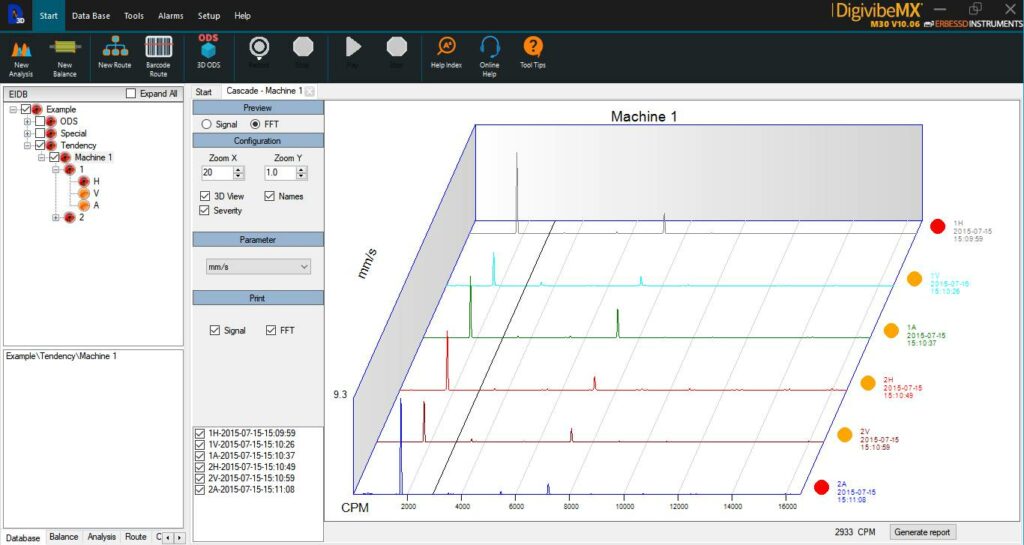
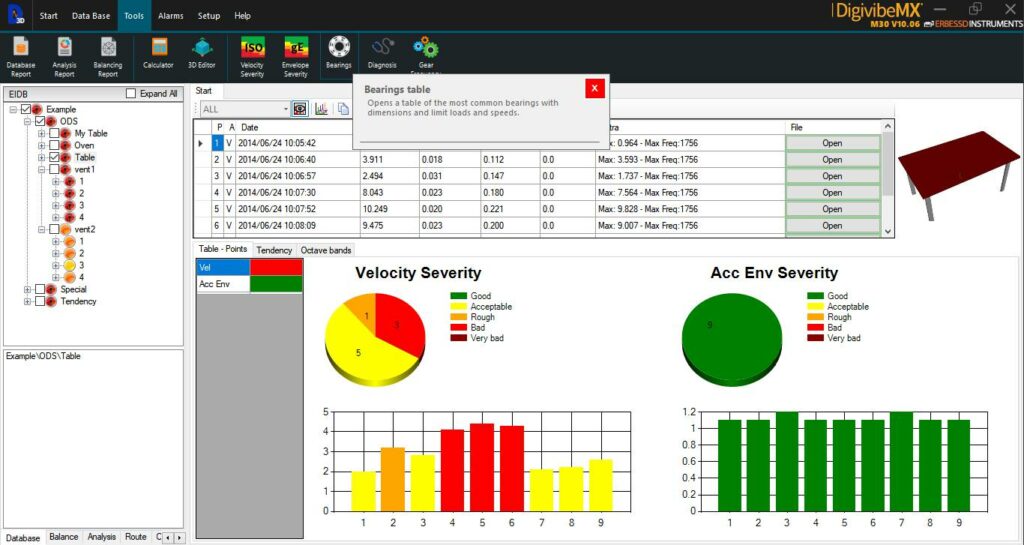
Predictive Analysis Tools
DigivibeMX M20 allows the user to perform predictive analysis of any machine located in the Machines Database. These tools are:
Tendency curves
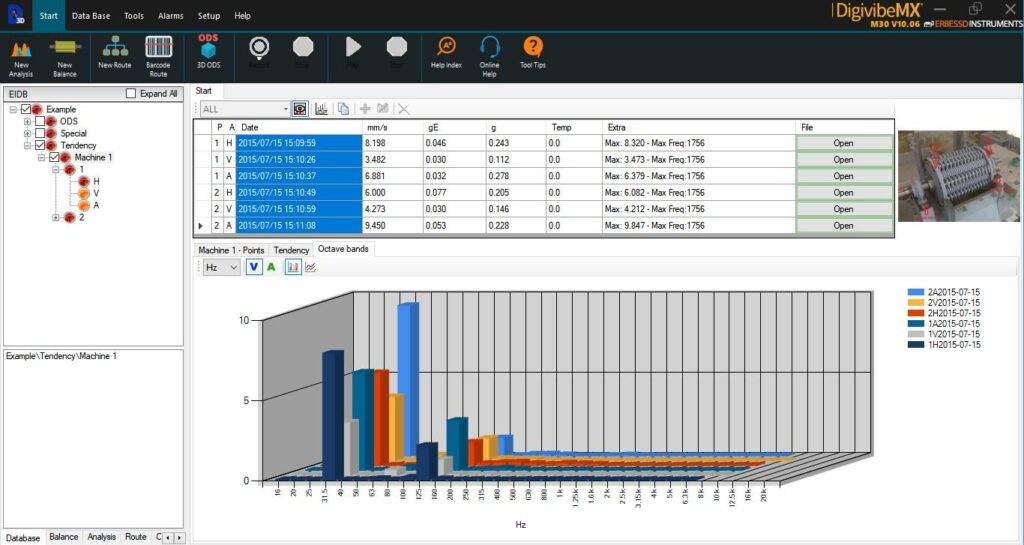
Cascade spectra
Velocity
Acceleration
Acceleration Envelope
Velocity
Acceleration
Acceleration Envelope
These tools permit to evaluate the evolution of vibrations produced by usual causes such as unbalance and electric noise but also by bearing defects and gearboxes.
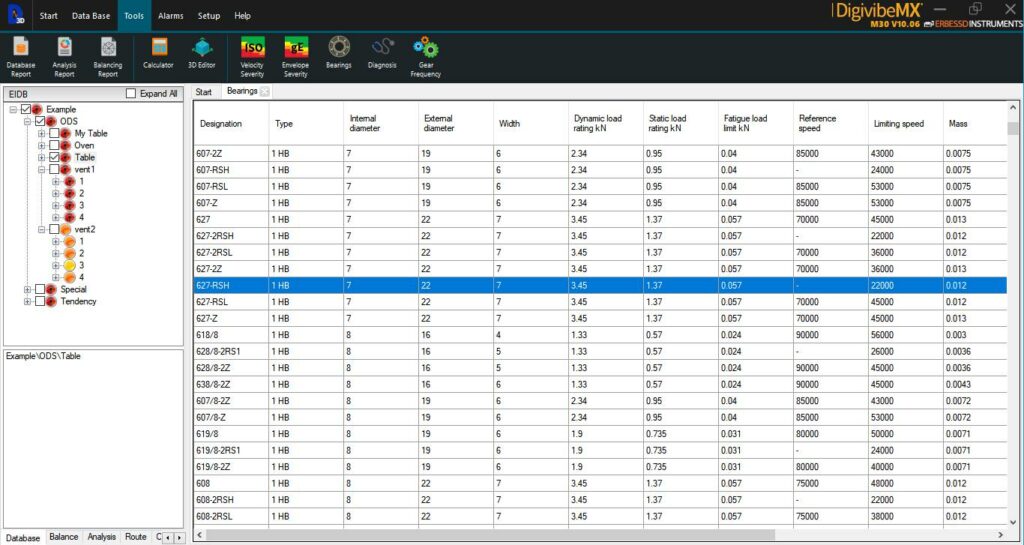
Bearings Database
DigivibeMXM20 has an expandable database with information of more than 20,000 bearings. The available data for each one is:
General Information
Frequencies calculator
Number and Type
Internal and External diameter
Width
Static and Dynamic load rating
Fatigue load limit
Reference and Limit speed
Mass
Step diameter
Number of rolling elements and its diameters
Pitch angle
Inner race defect
Outer race defect
Rolling element defect
Rolling element speed
Cage defect
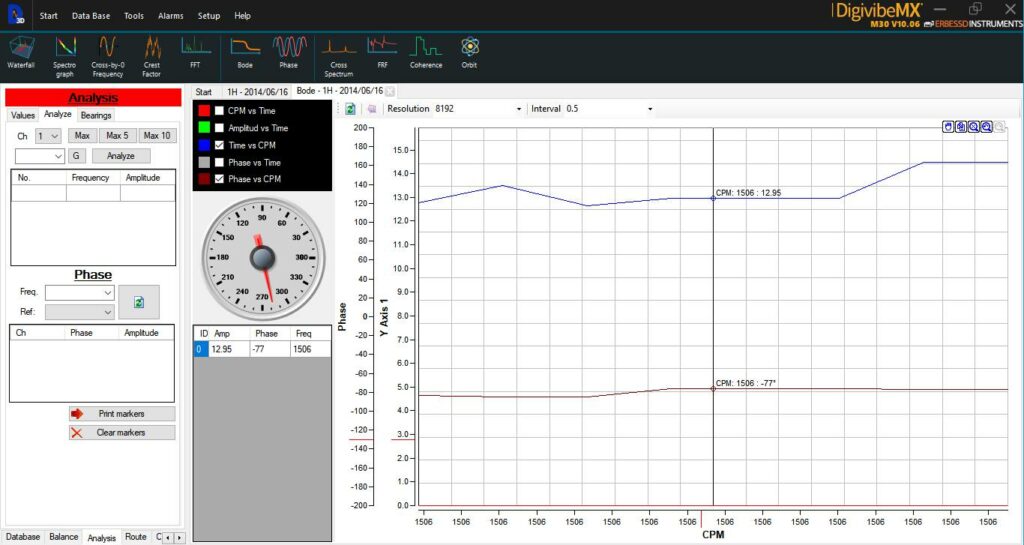
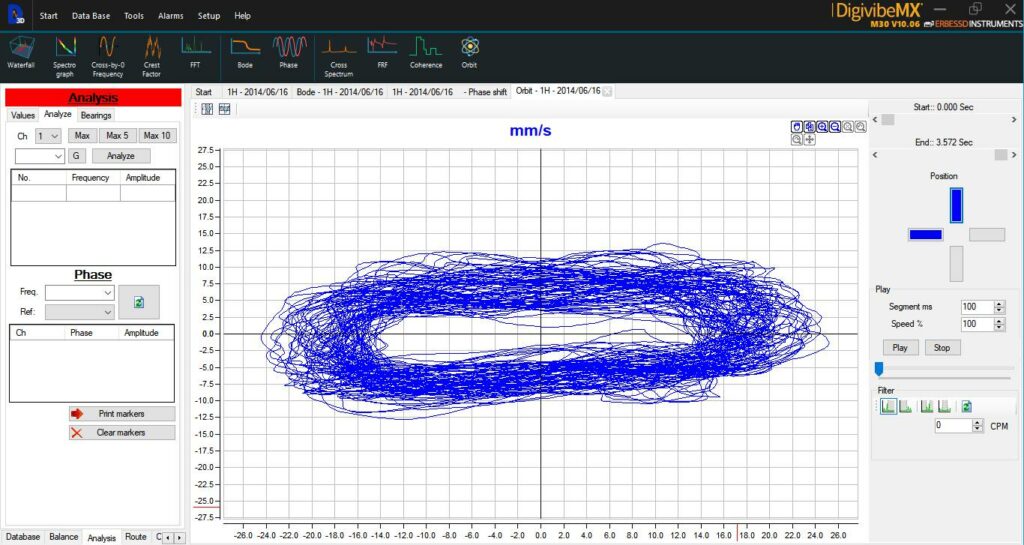
Dual Channel Functions
Dual channel analysis has huge advantages, not only because it saves time for the data collection, but also because it allows obtaining information that could not be acquired with a single channel analysis. For example: Orbits can be drawn and saved also for run down analysis to analyze critical frequencies and their real displacement axis.
Tools
Orbits
Bode Diagram
Cross Power Spectrum
Frequency Response Function
Coherence Function
Advanced Functions
The advanced vibration analysis allows the diagnose of complex failures, relation between points, vibration modes and struture analysis. DigivibeMX M30 has tools to export to universal file formats such as UFF58 and ASCII that may be used in other vibration analysis applications (such as Operating Deflection Shapes).
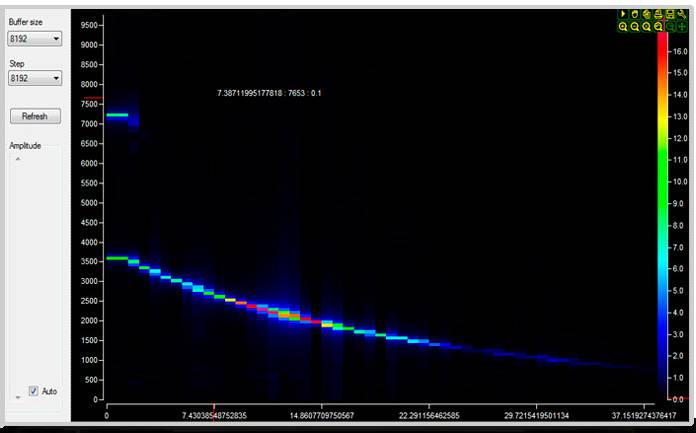
Spectrogram
A spectrogram is a time-varying spectral representation (forming an image) that shows how the spectral density of a signal varies with time. The horizontal axis represents time, the vertical axis is frequency; a third dimension indicating the amplitude of a particular frequency at a particular time is represented by the colour intensity of each point in the image. It is commonly used to find critical and natural frequencies.
Cross Power Spectrum
Or spectral density is a mathematical function that shows the distribution of the power or energy in a specific frequency range.
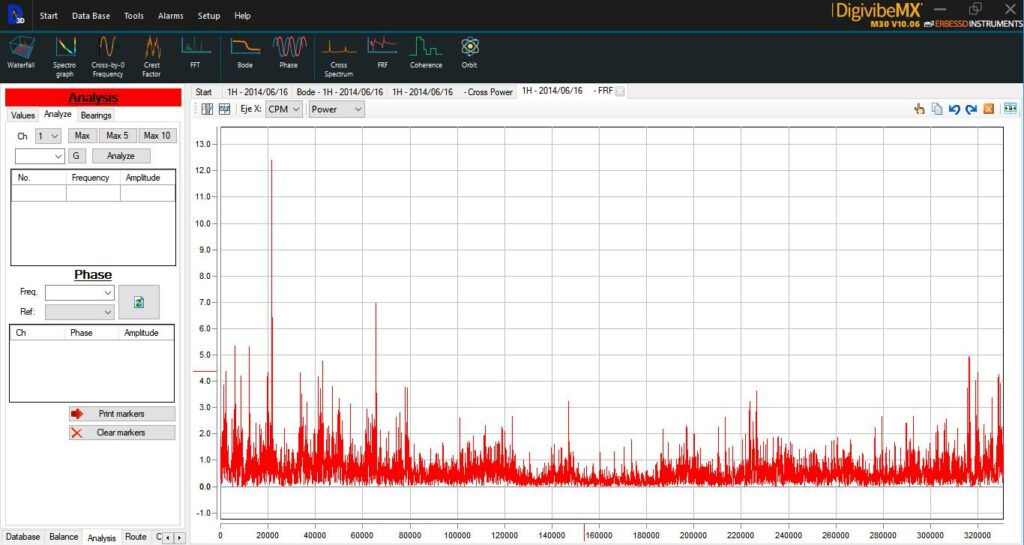
Frequency Response Function (FRF)
It’s the quantitative measure of the output spectrum of a system or device in response to a specific stimulus, and it is used to characterize the system’s dynamics.
Coherence Function
When interfering, two waves can add their amplitudes to create a greater amplitude wave than the first 2 (constructive interference) or subtract from each other to create a wave with less amplitude (destructive interference), depending on their relative phase. Two waves are said to be coherent if they have a constant relative phase.
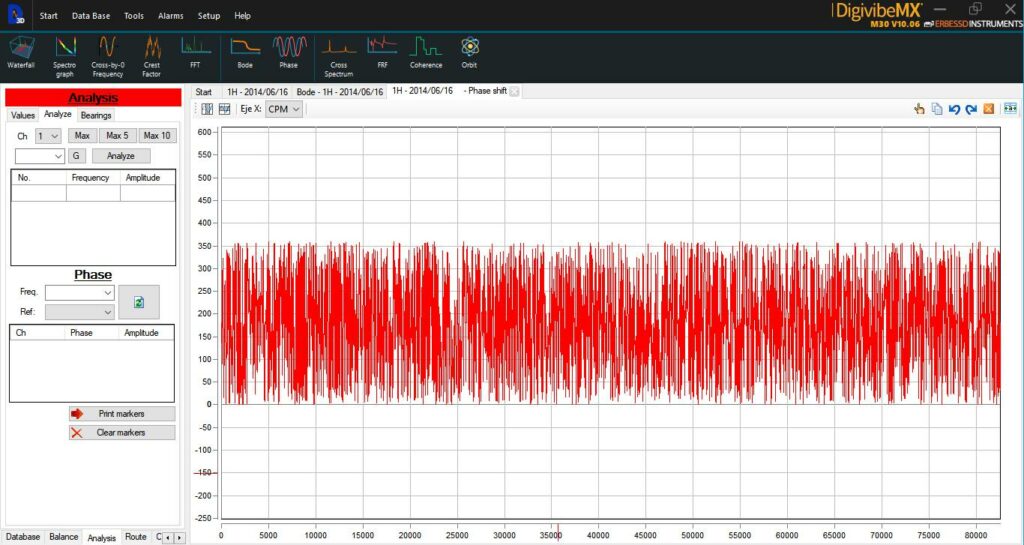
Crest Factor
The crest factor or peak-to-average ratio is a waveform measurement, calculated using the waveform peak amplitude divided by the waveform RMS value. It is used to measure the ratio of the peak power level to the time-averaged power level in an vibration signal.
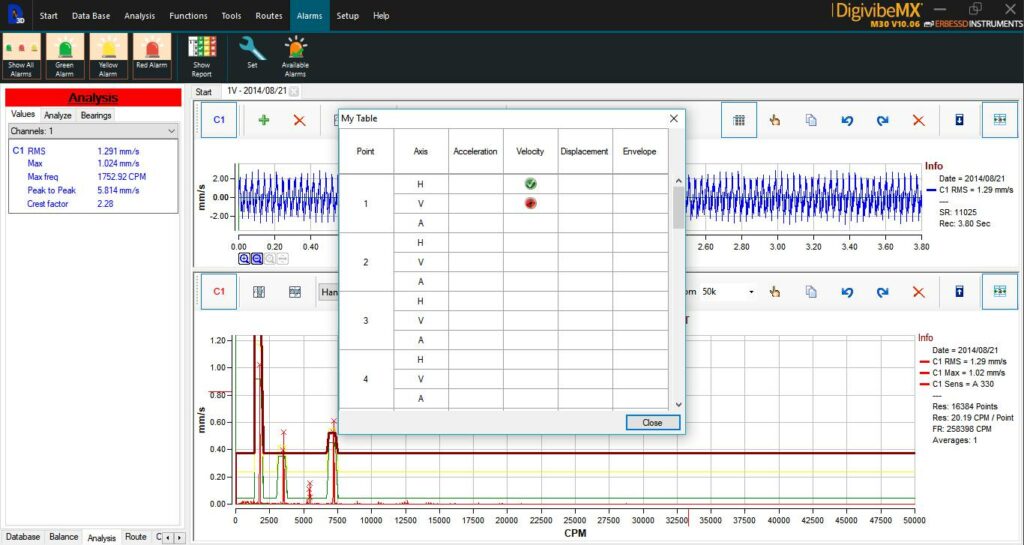
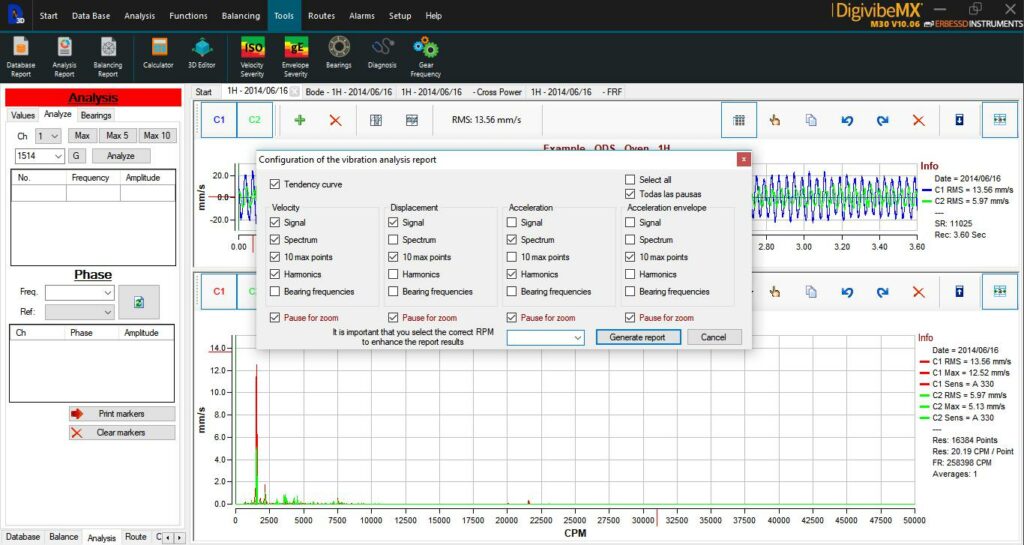
Automatic Reports
DigivibeMXM20 is able to generate automatic reports in Microsoft Word*, this way it is easy to add necessary information or remove useless data.
Features
Parameters: displacement, velocity, acceleration and acceleration envelope
Time domain graph and spectrum on each parameter
Highest points markers
Harmonics
RMS values
Marker values on separate table
*In order to generate those reports, you will need Microsoft Word 2007 or higher
IMPORTANT: Starter versions of Microsoft Office do NOT work.
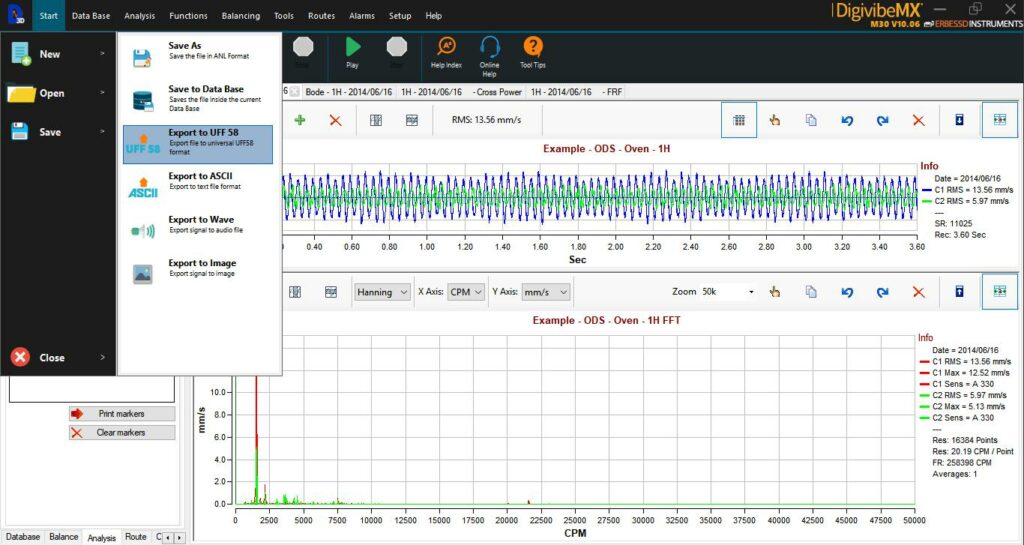
Compatibility
DigivibeMXM20 can export to 3 universal formats: WAV (audio), ASCII and universal file format UFF58.
WAV
Is an audio file that can be played with every audio software.
ASCII
This format produces a file in text format in which all channels are saved in columns. It does not have header and can be set according to the user’s needs.
Column Y Channel 1
Column X – [Separator]* – Column Y Channel 1
Column X – [Separator]* – Column Y Channel 1 – [Separator] * – Column Y Channel 2
* Separator can be defined by the user
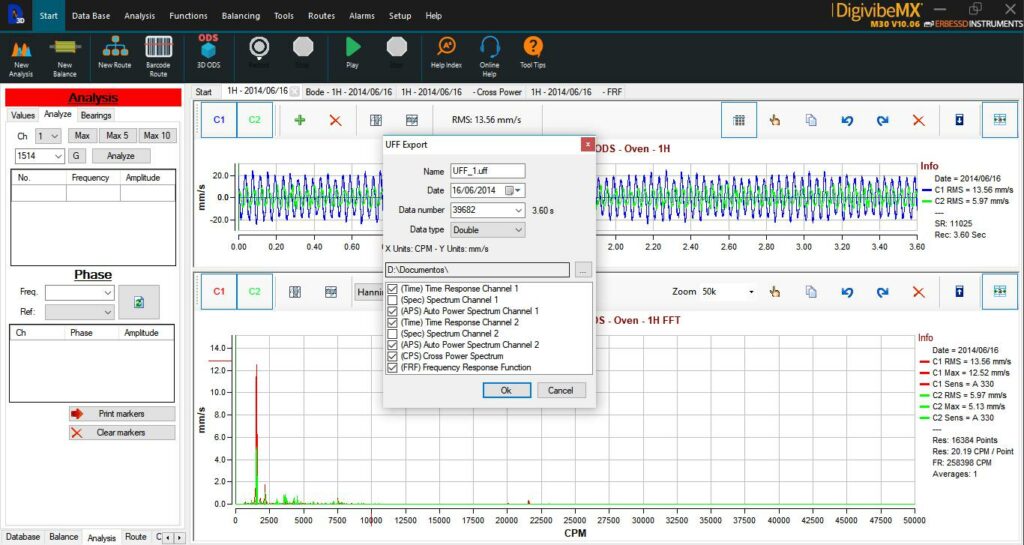
UFF58
Is the most used format for all vibration related software, especially by ODS programs. The UFF58 (Universal File Format) is a standard in the experimental dynamics (vibration and acoustic) community, particularly in the modal analysis area.
This format is written in ASCII but has a particular order in its content. It can have many headers so it can contain many signals as well as calculations for the same signals (i.e. APS Auto Power Spectrum, Cross Power Spectrum, etc.)