Introduction:
The application of different communication protocols in industrial processes is of great relevance nowadays for the interaction of condition monitoring and automation systems. These systems have sensors and actuators, which are used as means to interact with their environment. Most of these devices have wired or wireless communication systems, which help us to collect information about the condition status of the machines, number of repetitions in a process or for some cost analysis.
For this reason, the PHANTOM® condition monitoring system meets most of the above mentioned characteristics, since it allows us to know information about the machines, their condition, their repeatability and subsequently reduce costs in maintenance and production stoppages. In addition to these virtues, with the PHANTOM® system we can integrate the different parameters to an industrial communication network via Modbus TCP/IP.
In this document we will show an application of the different sensors installed in a plant located in Merida, Yucatan. These sensors are in charge of measuring vibration, temperature and current in machines such as milling machines, lathes, CNC machining centers and compressors. This paper presents the application of a SCADA system using RapidSCADA software to show the communication via MODBUS TCP/IP.
Approach:
As a first instance we have our PHANTOM® system Installed in a machine manufacturing shop. In this workshop we have installed 6 triaxial vibration PHANTOM®, 3 current PHANTOM® and 3 contact temperature PHANTOM®. This system can currently be reviewed in detail through the EI-Analytic™ platform. In order to have an easier way to appreciate the status of the machines, it will be applied in a SCADA system, as it allows to visualize the health of each machine as a traffic light.
Development:
To develop this system, we made an internal configuration in our gateway to allocate information in a memory space the data coming from each one of the sensors, in such a way that we have reserved 12 memory spaces. These memory spaces are distributed as follows:
| ID | Start Byte | Sensor |
|---|---|---|
| 1 | 1 | Triaxial Vibration |
| 2 | 51 | Triaxial Vibration |
| 3 | 101 | Triaxial Vibration |
| 4 | 151 | Triaxial Vibration |
| 5 | 201 | Triaxial Vibration |
| 6 | 251 | Triaxial Vibration |
| 7 | 301 | Current |
| 8 | 351 | Current |
| 9 | 401 | Current |
| 10 | 451 | Temperature |
| 11 | 501 | Temperature |
| 12 | 551 | Temperature |
With this configuration, we will be able to have the sensor’s information through the gateway using MODBUS TCP/IP.
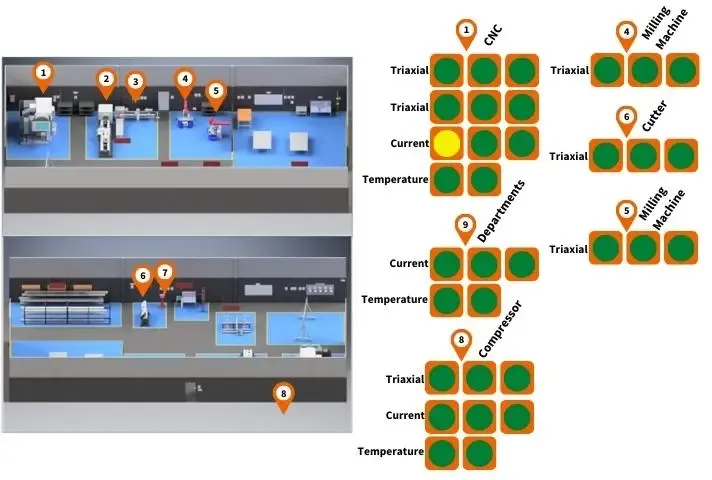
For the SCADA system, we proceed to make our distribution for the interface, indicating each sensor and its corresponding token.
Once we have our graphic distribution, we proceed to process the information. To do so, we first store each value obtained by the sensor in a memory space assigned according to the offset provided by the PHANTOM® system data sheet. We take sensors 1, 7 and 10 as an example.
| Byte | Description |
|---|---|
| 1 | Node ID |
| 3 | Sensor Type |
| 4 | RMS channel 1 |
| 6 | RMS channel 2 |
| 8 | RMS channel 3 |
| 10 | Battery voltage |
| 12 | Sensor Temp. |
| 14 | Firmware Version |
| Byte | Description |
|---|---|
| 301 | Node ID |
| 303 | Sensor Type |
| 304 | Battery Voltage |
| 306 | Sensor Temp. |
| 308 | Firmware Version |
| 310 | sequence |
| 311 | Average current ch 1 |
| 312 | Average current Ch 2 |
| 313 | Average current Ch 3 |
| 314 | Average current Ch 4 |
| Byte | Description |
|---|---|
| 450 | Node ID |
| 452 | Temp. Channel 1 |
| 454 | Battery voltage |
| 456 | Sensor Temp. |
| 458 | Firmware version |
| 460 | Temp. Channel 2 |
| 462 | Temp. Channel 3 |
This configuration can be seen in RapidSCADA:
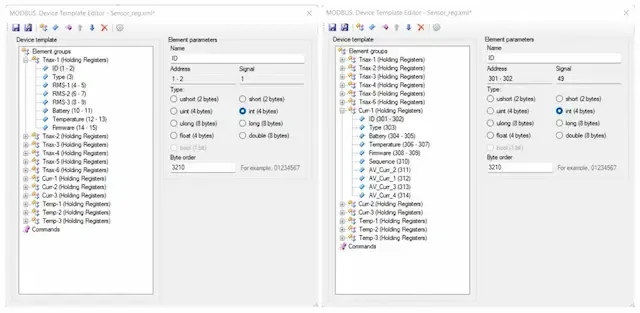
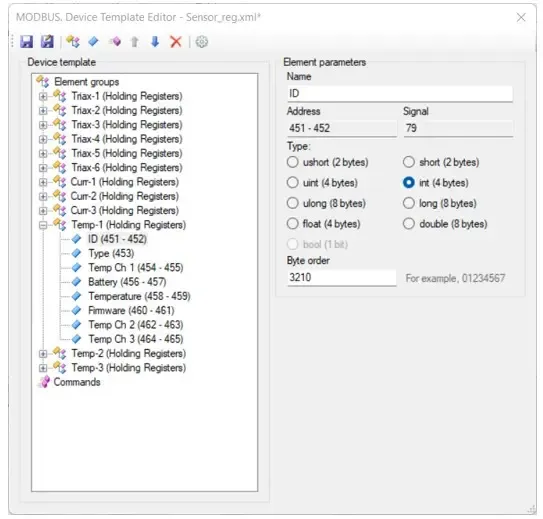
It should be noted that the sensor data format is little-endian.
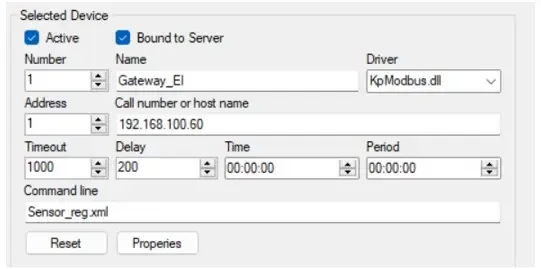
When we finish implementing the data logs, we link the RapidScada software to our gateway through the IP address:
Results:
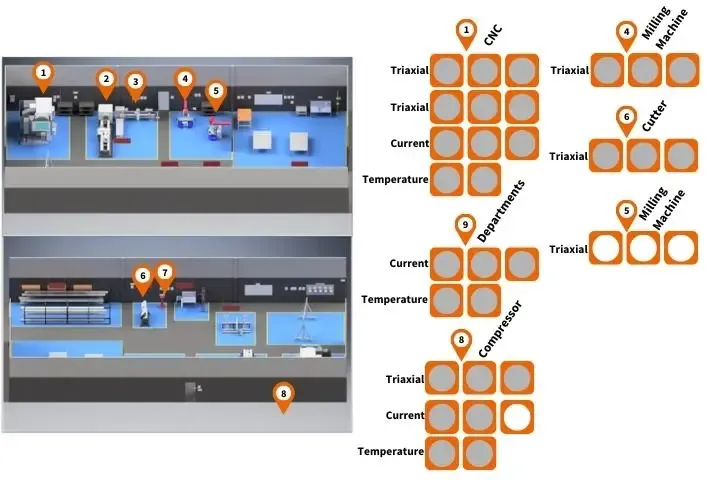
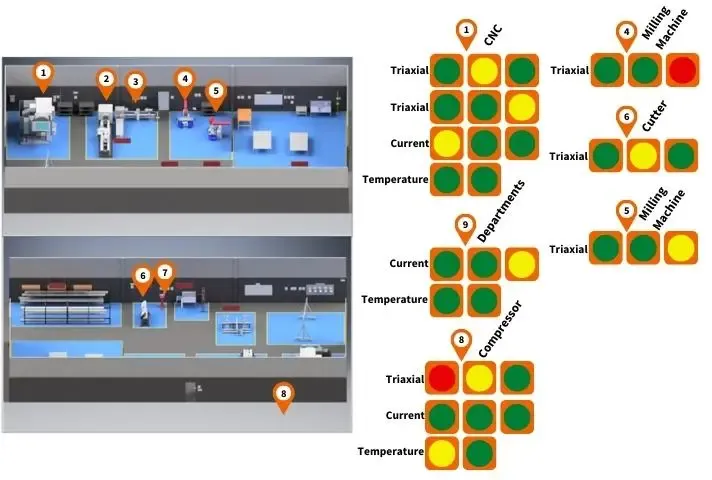
As results we can appreciate in the images the monitoring of certain machines through the SCADA system with several indicators, which help us to know their current status. Each sensor has a witness for each channel, vibration in the 3 axes, 3 phases of current, in addition to the temperature sensor with 2 channels.
As a first approximation, values were established with which the green, yellow or red indicators would be activated, in order to know the condition of the machinery according to its operations. Next, we present 3 images of the SCADA system in 3 different days.
On day 1, some machines are observed in alert status, it was verified that the machines with this condition were working properly and adjustments were made with the parameters to display each of these witnesses.
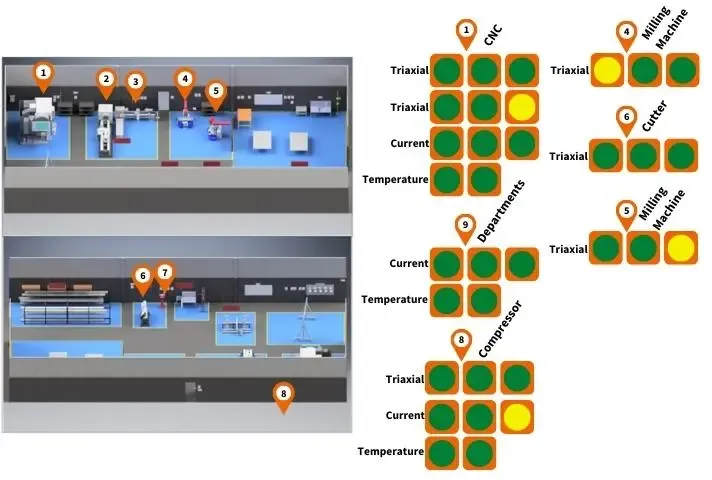
On day 2, the alarm condition indicators of each sensor are observed in good condition and some machines in warning status, the machines were checked again until the limits of each sensor status were adjusted again.