Almost every condition monitoring platform on the market now shows you an automated diagnosis. You open the dashboard and there it is: angular misalignment, 78.9%. It looks professional, it looks modern, and it tells you absolutely nothing about where that number came from.
That is the problem. With that screen in front of you, you have to decide whether to stop a production line. If the diagnosis is right and you do nothing, the machine will collect the bill later, at its own price. If it is wrong and you act, you have spent a full shift tearing down healthy equipment. Either way, the person signing that decision is you — not the software.
So the question that matters when you evaluate a platform is not does it have automated diagnosis? By now they all say yes. The question is how far it lets you go when you want to know why.
Below are five questions worth taking to any vendor demo — ours included. You do not need to be a vibration analyst to ask them. You do need the vendor to open the box.
- Can you see why it reached that diagnosis?
- Can you change its mind?
- How much information does it use to decide?
- Does it tell you how confident it is?
- Does it adapt to your machine?
And a sixth point that is not a question but needs saying: where artificial intelligence actually fits. Then how all five played out on a real machine — including what the engine needs from you to work.
1. Can you see why it reached that diagnosis?
A diagnosis without a justification is not a diagnosis. It is an opinion in the shape of a report.
Ask the vendor to open any diagnosis and show you the full reasoning. Not the summary — the reasoning. You should be able to see which conditions were evaluated, which ones were met, which ones were not, and with what numbers.
In EI-Analytic™ that screen is the diagnosis. On the left, the candidate faults appear ranked by probability, each one carrying the count of conditions that support it: bent shaft, 100%, 3 of 3 rules met; angular misalignment, 78.9%, 3 of 5; parallel misalignment, 30.6%, 4 of 7. That alone changes the picture — it is not a verdict, it is a ranked set of hypotheses with their evidence in plain sight.
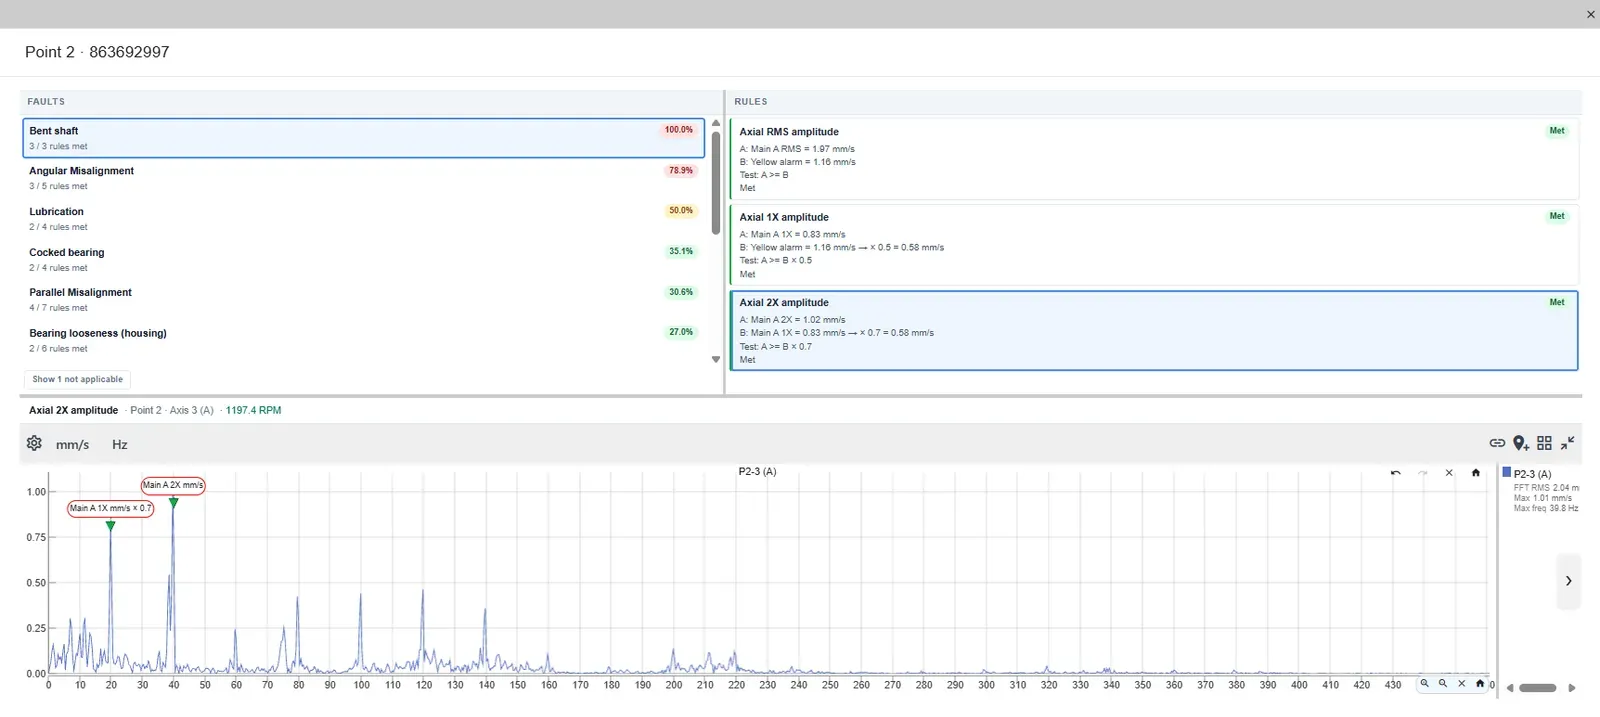
On the right sits the breakdown of each rule, and this is where the argument about transparency ends. A rule does not show up as a green label. It shows up with its full arithmetic:
Axial 2X amplitude — Met
A: Main A 2X = 1.02 mm/s
B: Main A 1X = 0.83 mm/s → × 0.7 = 0.58 mm/s
Test: A >= B × 0.7
You can read where every value came from, what it was compared against, which factor was applied, and why the result was what it was. Nothing here has to be taken on faith. It can be checked.
And there is a third level that usually exists nowhere else. Select a rule, and the spectrum below marks the exact peaks that rule used. You see the 1X flagged, you see the 2X flagged, you see the threshold drawn. If you think the software misread the spectrum, you do not have to argue about it in the abstract — you are looking at it, marked, on your own measurement.
2. Can you change its mind?
Nobody knows your machines better than the people who run them. An induced-draft fan with twenty years on it has a normal behaviour that matches no catalogue, and you know that. The software does not.
So the second question is blunt: can I modify the rules, or only accept them? Ask it precisely, because two very different answers sound alike. Almost any platform will let you add your own rules on top of theirs. Far fewer will let you edit the ones that ship with the product.
In EI-Analytic™ the factory rules are editable. You can change their thresholds, their factors, the points and axes they compare, or disable them for one particular machine. You can also build new faults and new rules from scratch, with whatever conditions you define.
The platform ships with thirteen fault types — static, couple and dynamic imbalance; parallel and angular misalignment; bent shaft; bearing fault stages 2, 3 and 4; cocked bearing; bearing looseness; and lubrication — plus a machine-off state, so the engine knows when not to diagnose. That list is a starting point, not a ceiling.
There is a consequence here worth saying out loud: a platform whose rules cannot be touched is asking you to accept a third party’s judgement about your equipment, indefinitely. When the system gets your twenty-year-old fan wrong — and it will — you will have no way to teach it.
3. How much information does it use to decide?
This is the technical question, and it separates real diagnostic engines from systems that just compare numbers against thresholds.
Static imbalance and parallel misalignment can produce almost identical spectra: a dominant 1X in both cases, similar amplitudes, the same general shape. If your system only looks at amplitudes, faced with those two spectra it can do nothing but pick one. It is not that it gets it wrong occasionally — it has nothing to get it right with.
What the spectrum shows
A dominant peak at 1X, well above the alarm reference, with 2X clearly below it. Amplitude alone puts static imbalance and parallel misalignment in the same place, because both faults excite the running speed.
What separates them
The phase between measurement points: close to 0° for static imbalance, close to 180° for parallel misalignment. Same spectrum, opposite readings — and the difference decides which repair you schedule.
That phase relationship is the same information an experienced analyst goes looking for with the instrument in hand, and it settles the case in seconds.
As of today, Erbessd Instruments is the only manufacturer whose diagnostic engine uses phase between points as a condition inside its rules — not as a value you can look up separately, but as a condition the system evaluates on its own, every time, to decide between two faults that look the same in the spectrum.
You do not have to take that on trust either. Open the rule editor on any fault and the phase rules are sitting there, by name.
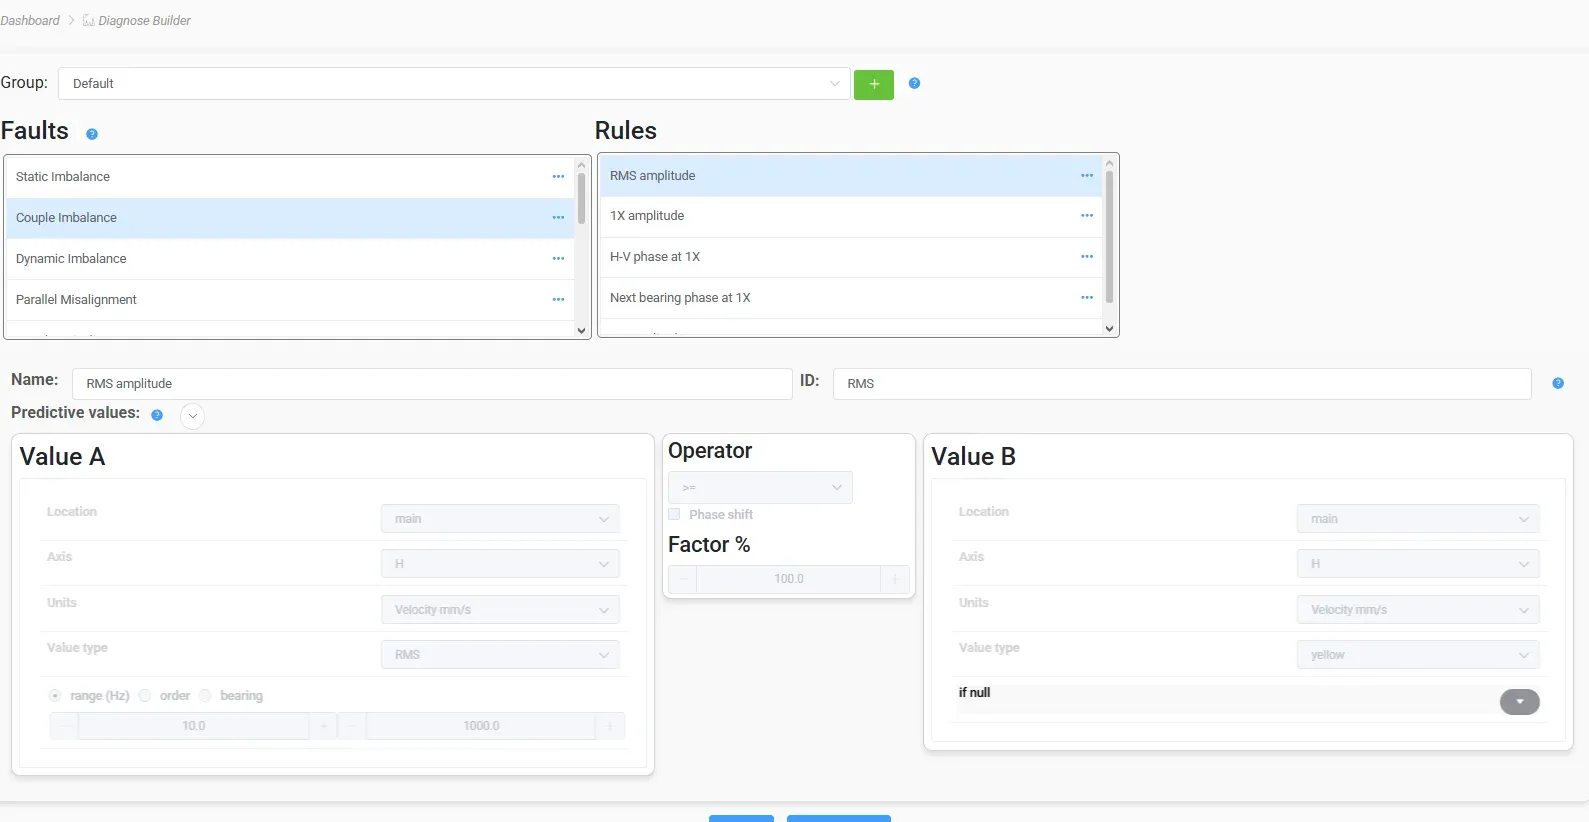
H-V phase at 1X compares phase between two axes on the same point. Next bearing phase at 1X compares it against the next bearing along the train — that is the between-points comparison the whole question turns on. And the operator carries its own Phase shift option, because comparing two phases is not the same arithmetic as comparing two amplitudes.
Note what else that screen settles, without a word of marketing: those are factory faults, and every field of every rule is a control you can change. That is question 2, answered by the same screenshot.
The demo question writes itself: show me how your system tells static imbalance apart from parallel misalignment. The answer will tell you which category of product you are looking at.
4. Does it tell you how confident it is?
A system that only says there is misalignment leaves you two options: believe it or ignore it. One that says 78.9%, with 3 of 5 conditions met leaves you something far more useful: a decision.
Behind that percentage sits a principle not every system applies: not all evidence weighs the same. Some conditions barely suggest a fault when present, but rule it out almost entirely when absent. Others work the other way around. EI-Analytic™ weights each rule by its predictive value — what it is worth when it is met, and what it is worth when it is not — and the percentage comes out of that weighting, not out of a simple count.
The practical effect is that the middle of the range means something. A 30.6% is not the software couldn’t tell; it is four conditions point that way, three do not, and the missing ones are among the heavier ones. That is enough to prioritise this week’s route.
If you want the technical background on that weighting, it is developed in Is Your Vibration Diagnostic System a Black Box or a White Box?
5. Does it adapt to your machine, or does your machine adapt to it?
The finest rules in the world are worth little if they run against the wrong references. A rule that compares against the yellow alarm is exactly as good as that alarm.
What has to be configurable, machine by machine and point by point: severity levels per axis (the ISO standard that ships by default is a starting point, not an answer for your equipment), the real operating RPM range, the specific bearing installed, the coupling between points, and the ability to record synchronised measurements at two points at once — without which, incidentally, the phase comparison from question 3 does not exist.
And there is a second half to this question that almost nobody asks: can it tell you how much of that configuration is actually done?
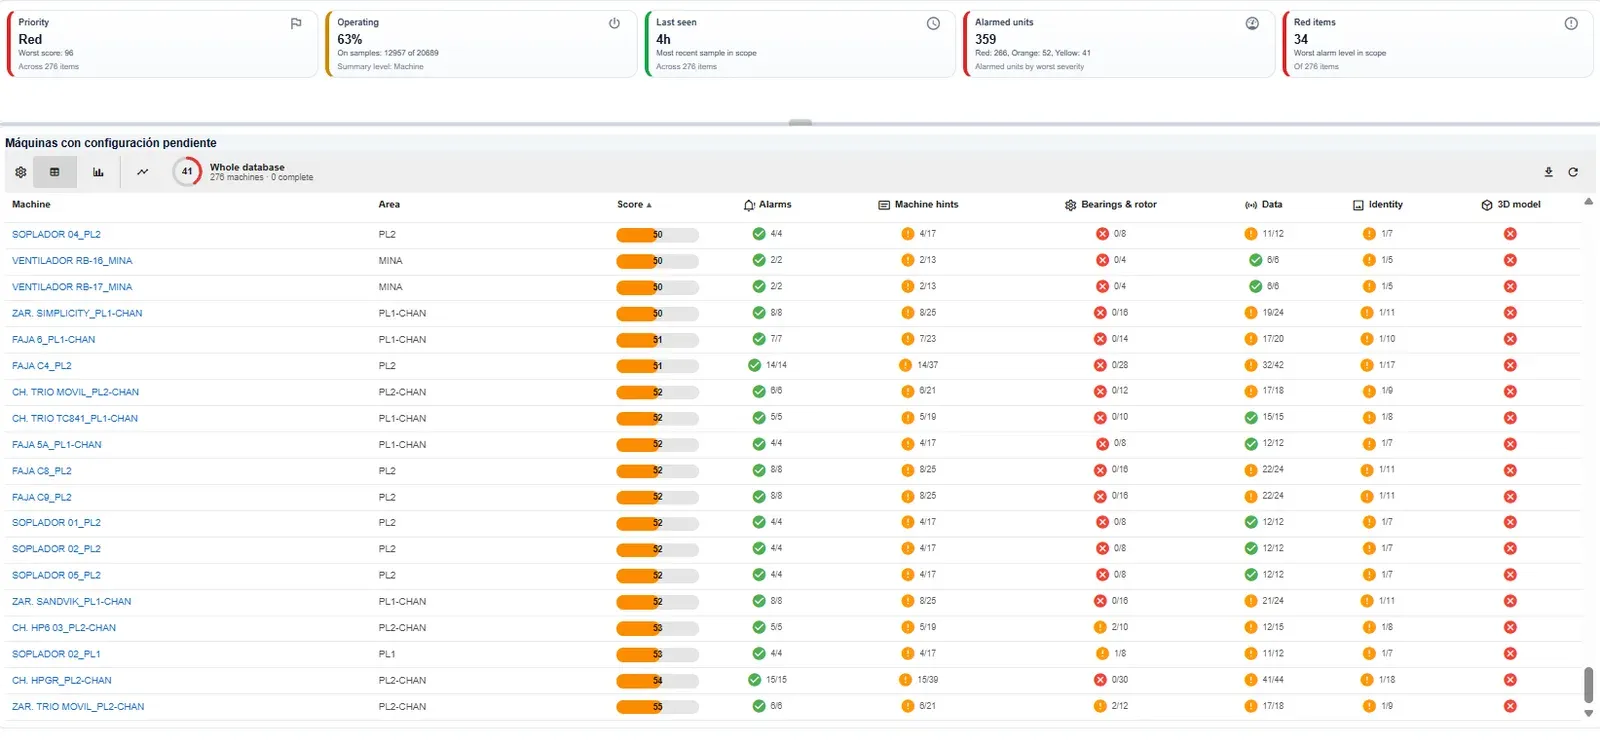
That is a real plant — 276 machines, and not one of them fully configured. Alarms are in good shape, the data is arriving, and the bearings column is red almost all the way down, which means every bearing rule on those machines is dead weight until someone declares them.
The point is not that the configuration is finished. It is that the platform tells you what is missing, machine by machine, instead of quietly diagnosing over the gaps — and that turns an invisible problem into a work list somebody can actually close.
This is the quiet argument underneath all of the above: the automated diagnosis is only as good as the configuration feeding it. A platform that will not let you describe your machine accurately — or will not admit how much of that description is still missing — is not going to diagnose it accurately, however sophisticated its engine.
A sixth point: where artificial intelligence fits
This is worth spelling out, because an article that opens with be suspicious of black boxes and then talks about AI reads strangely unless each part’s role is clear.
In EI-Analytic™ the artificial intelligence does not issue the diagnosis. The rules do, and they are verifiable one by one, as we just saw. What the AI does is something else: read the whole picture and explain it to you.
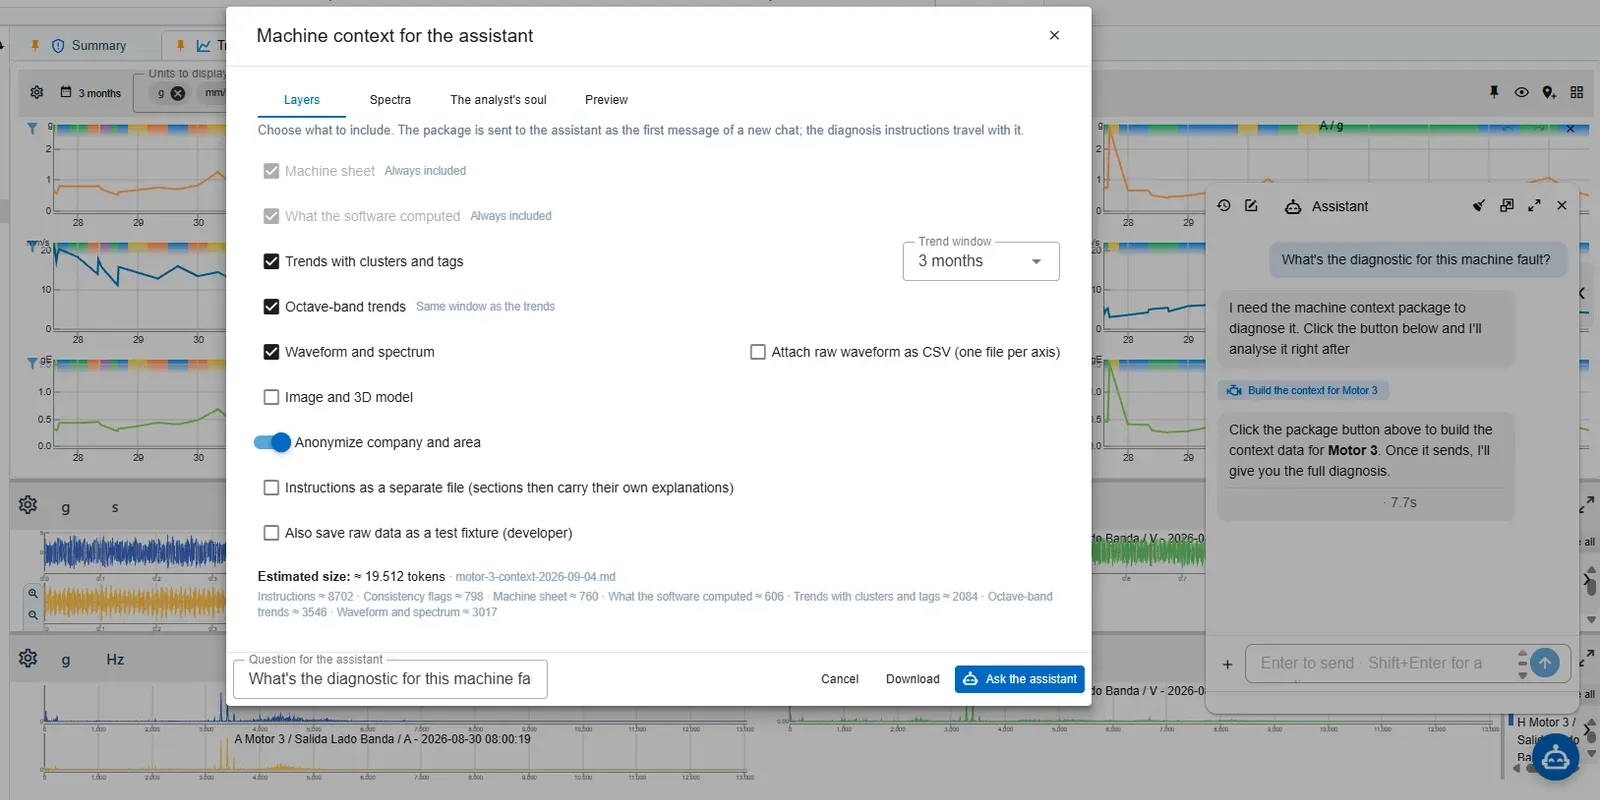
When you ask it for an analysis, the system assembles a context package from whatever you choose to include — the machine sheet, what the software already computed, the trends for the period, the octave bands, the waveform and the spectrum — and shows you in advance the exact size of that package and what it is made of. You can also anonymise the company and area names before sending it.
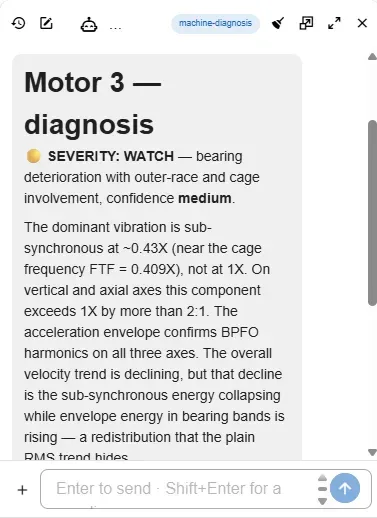
What comes back is not a verdict; it is a report with its evidence attached: severity, confidence level, the reasoning, and the data tables it rests on — amplitudes per axis, frequencies, ratios against 1X, envelope evidence with the bearing fault frequencies. Every claim arrives with the figure that supports it and the section it came from.
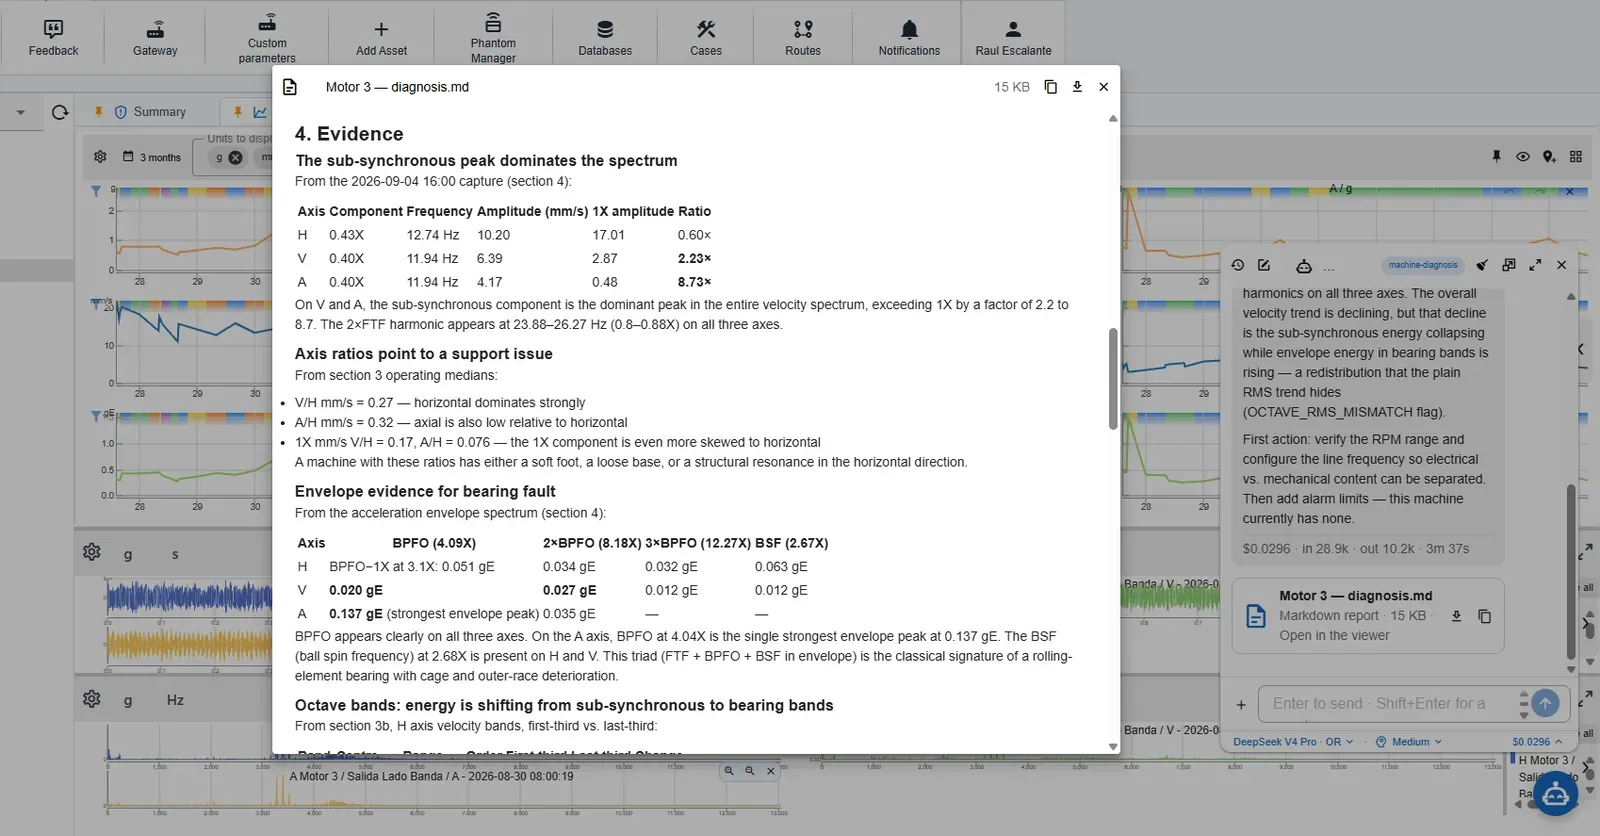
In other words: the AI here works under the same rule as everything else. It can be wrong, and that is precisely why it hands you the numbers you would need to contradict it.
How this looks on a real machine
This one is not a demo. It is an Aerzen air compressor at a cement plant in Mexico, turning at 9461.5 RPM, and it is the reason the five questions above are not theoretical.
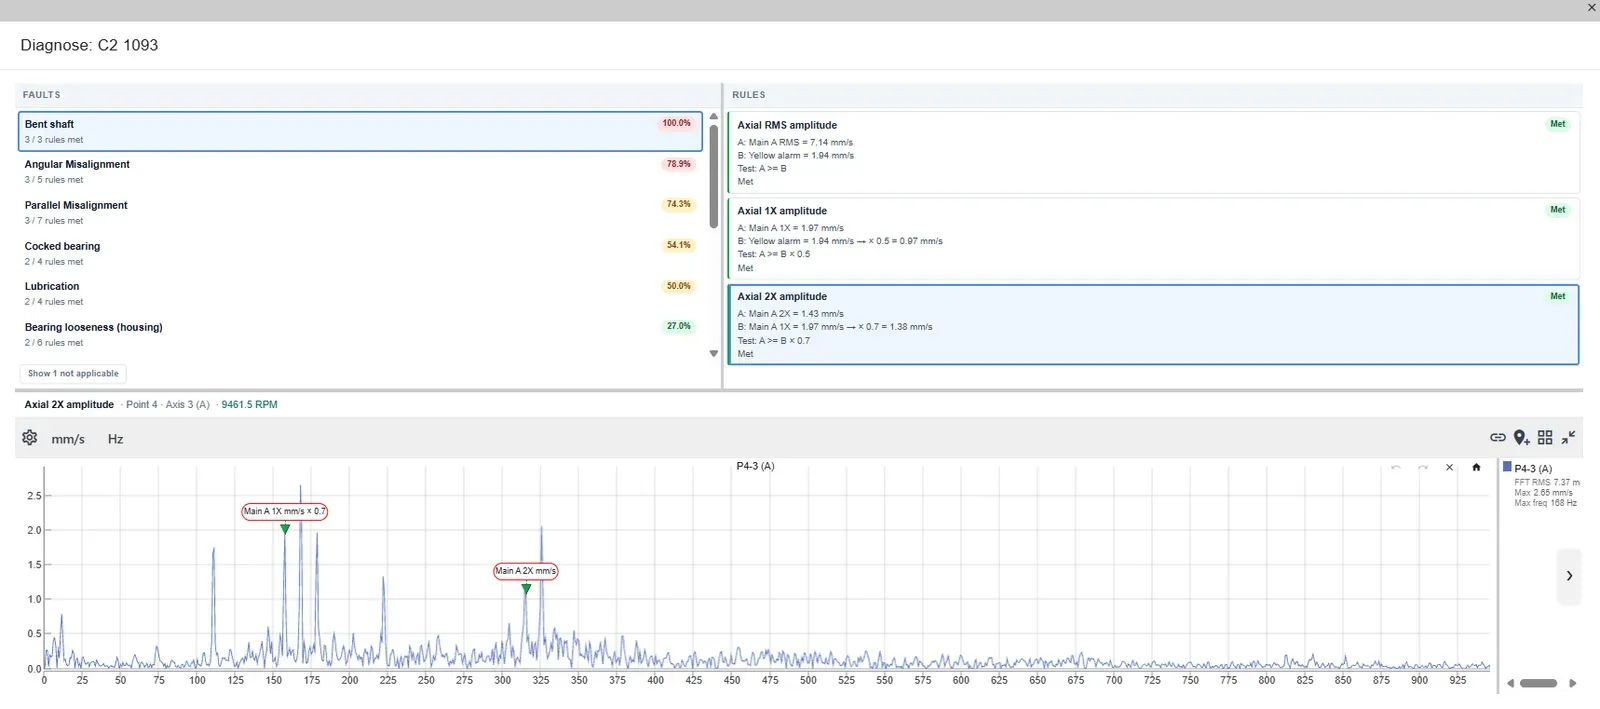
The engine put bent shaft at 100%, with 3 of 3 rules met — and, crucially, it showed which three: axial RMS at 7.14 mm/s against a yellow alarm of 1.94 (nearly four times over), axial 1X at 1.97 mm/s against half that alarm, and axial 2X at 1.43 mm/s.
Now look at what only the arithmetic tells you. That third rule needed the axial 2X to reach 70% of the 1X — 1.38 mm/s. It measured 1.43. The rule was met by four hundredths of a millimetre per second. The diagnosis is still correct, but its margin was thin, and you can see that it was thin. A platform that printed “bent shaft, 100%” and nothing else would have handed you the same conclusion with the same confidence and no way to know how close the call had been.
Then read the two lines below it: angular misalignment at 78.9% and parallel misalignment at 74.3%. That is not the engine hedging. All three faults produce axial vibration, so they share part of the evidence — and the rules the other two failed to meet are exactly what a human analyst would have gone looking for next. A single number would have hidden all of it. The ranking put the competing hypotheses, and their gaps, in front of the analyst.
The shaft was bent.
What the engine needs from you
Here is the part most vendor articles leave out. The rules engine is only as good as the window it is allowed to look through, and there are three ways to narrow that window without noticing.
The database has to be right first. The engine does not discover your machine — you describe it, and it reasons over that description. A rule that needs the bearing’s fault frequencies cannot fire if no bearing has been declared at that point; a rule that compares phase cannot run if the coupling and the second point are not in the database. This is genuine work, and there is no version of this technology that skips it. It is also the honest answer to the question everybody asks: no, the system does not do everything by itself.
Alarm limits are the sharpest case of the same thing. A rule that compares against a yellow alarm cannot be met if no alarm is configured. On a machine with empty thresholds the engine is not wrong — it is silent, which is worse, because silence reads like good news.
And the acquisition band is the subtle one. The rules run on the trend data, within the band you configured — so on a slow machine, a dominant component below the start of that band is invisible to them. We have seen a case where the strongest peak in the spectrum sat below the trend’s lower limit, and the engine ranked the faults it could see. It was reasoning correctly over incomplete evidence.
None of those is a reason to distrust the tool. They are the reason the tool shows you the spectrum, the rule counts and the assistant’s full report instead of a single verdict — so that when the window is too narrow, you can see that it is, and widen it. A system that only printed a percentage would have given you the same wrong answer with none of the clues.
Where this pays off most
The value scales with the size of the problem. With fifteen machines and a good analyst, this buys you less than you would think — that person already knows which one sounds wrong. It changes completely at hundreds of points, where the route cannot reach everything: the engine does not analyse better than an expert, it analyses everything, every night.
Machines with a genuinely variable process take more setting up. All of this rests on comparing against a reference, and equipment whose speed and load change constantly has no stable normal, so alarms and rules fire on operation rather than on faults. It can be configured around — just plan for that work rather than discovering it later.
Where this leaves you
If a vendor answers all five without flinching, you are looking at a system you can audit — one where a diagnosis is a starting point for your own judgement rather than a substitute for it. If any answer ends in the algorithm determines that, you already know what you are buying: a number on a screen, and all of the responsibility on your side.
We would rather be asked than believed.
Further reading